
Loading · 加载中
Loading · 加载中

Issue #12 is a source-verified decision brief for sovereign wealth funds, national tourism strategy agencies, cross-border real-estate and infrastructure investors, aviation, fintech and luxury hospitality. Coverage September 11–13: US August CPI printed +3.4% YoY, lifting FOMC odds of a 25bp hike to ~90% for the September 15–16 meeting; BOJ's hike to 1.25% is locked in for September 17–18 as the yen strengthened to ~153.5; the Saudi East-West pipeline was shut after a drone attack, pushing Brent to a $109.51 peak; Anthropic is pursuing a ~$100B IPO at a ~$2 trillion valuation with Nvidia in talks for a $10B anchor stake; Circle Arc launches September 16; airBaltic filed Chapter 11; ATM Dubai opened and the World's 50 Best Hotels ceremony is September 15. The Saudi government-contract freeze advisory remains in force.

AI interfaces, efficient models, and computational biology reveal a larger strategic question: who can turn technological change into a durable advantage? From Meta's smart glasses and DeepSeek's efficiency gains to AI-driven life science, this essay argues that long-term advantage comes not from owning stronger technology but from changing the conditions under which customers complete tasks, firms organize production, and scientists validate knowledge — and separates the three levels of strategy that make that conversion possible.
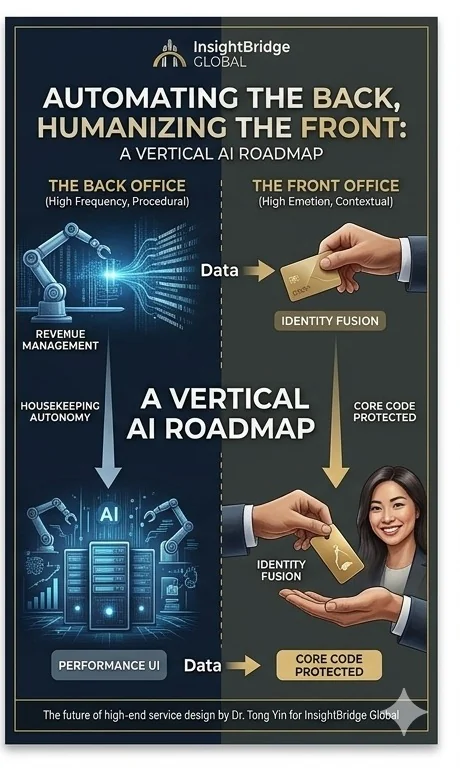
London's cost increases are legislated, not cyclical — wages, rates and network charges rise regardless of occupancy. The defensible response is selective automation of measurable back-of-house work, with human capability protected at the emotionally weighted touchpoints that justify a luxury rate.
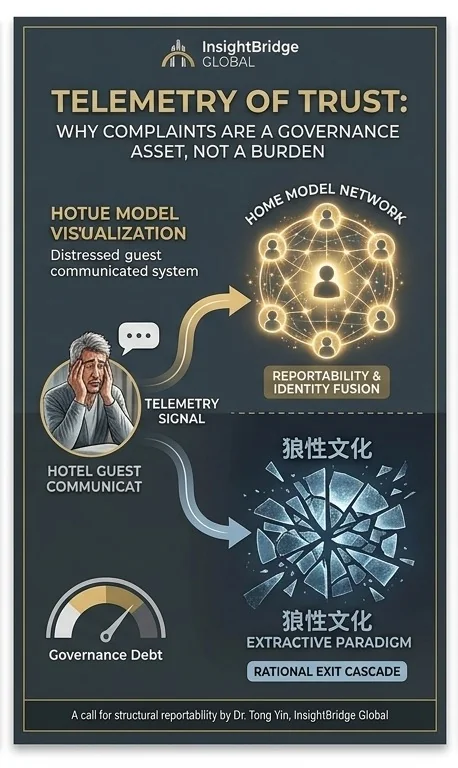
In luxury hotels, online reputation is a weak short-run pricing lever (0.44% ADR per 1% score gain) and a strong governance signal. Complaint patterns are the earliest legible evidence of broken handoffs, missing AI guardrails, fragmented data and eroding tacit capability.

London absorbed 69% of UK hotel investment in H1 2026 and paid 27% more per key, yet luxury hotels grew revenue per room while losing profit per room. The gap sits in costs — payroll, business rates, network charges, refinancing — that never reach the profit measure on which operator fees are calculated.

Between 13 May and 14 July 2026, Dr. Tong Yin published a sequence of articles on Hotel News Resource examining Saudi Arabia's Vision 2030 ultra-luxury tourism program. Within four to eight weeks, the market rendered its verdict. GASTAT confirmed ADR down 11.4% YoY, JLL confirmed Riyadh occupancy down 13.5pp, NEOM was redesigned, The Line was deferred to 2030 with $8B written off, Mukaab was suspended, and PIF earmarked $16B for contract terminations. This scorecard returns to the original predictions in public and grades them — not for vindication, but for method.
Issue #11 is a source-verified decision brief for sovereign wealth funds, national tourism strategy agencies, cross-border real-estate and infrastructure investors, aviation, fintech and luxury hospitality. Coverage Sept 7–10: ECB hiked to 2.50% on Iran-driven inflation; BOJ's Sept 17–18 hike to 1.25% is locked in as the yen strengthened past 154; Canada's C$27.6B retaliatory tariffs took effect; the largest tanker-attack wave of the US-Iran war sent Brent above $106/barrel and 10Y Treasury yields to 4.95%; Cognition AI raised $2B at a $48B valuation and Mistral AI closed Europe's largest-ever private tech financing at €21B; ADQ confirmed all conditions met for the AD Ports take-private (window closes Sept 15); the AfDB AFDB1JP00001430 EOI closes Sept 14; the CLARITY Act faces a Sept 15 Senate cloture vote; and Circle Arc mainnet launches Sept 16. The Saudi government-contract freeze advisory remains in force.

Information overload, generative AI, and trust erosion are splitting the content economy into three tiers: an open discovery layer, a registered membership layer, and a professional institutional layer. The right metaphor is not a wall but a semi-permeable membrane that lets abstracts and metadata pass outward while keeping full text, raw data, and identity-based relationships inside. This essay maps the operating logic, compliance envelope, and unit economics of each tier across media, academic publishing, and institutional research.
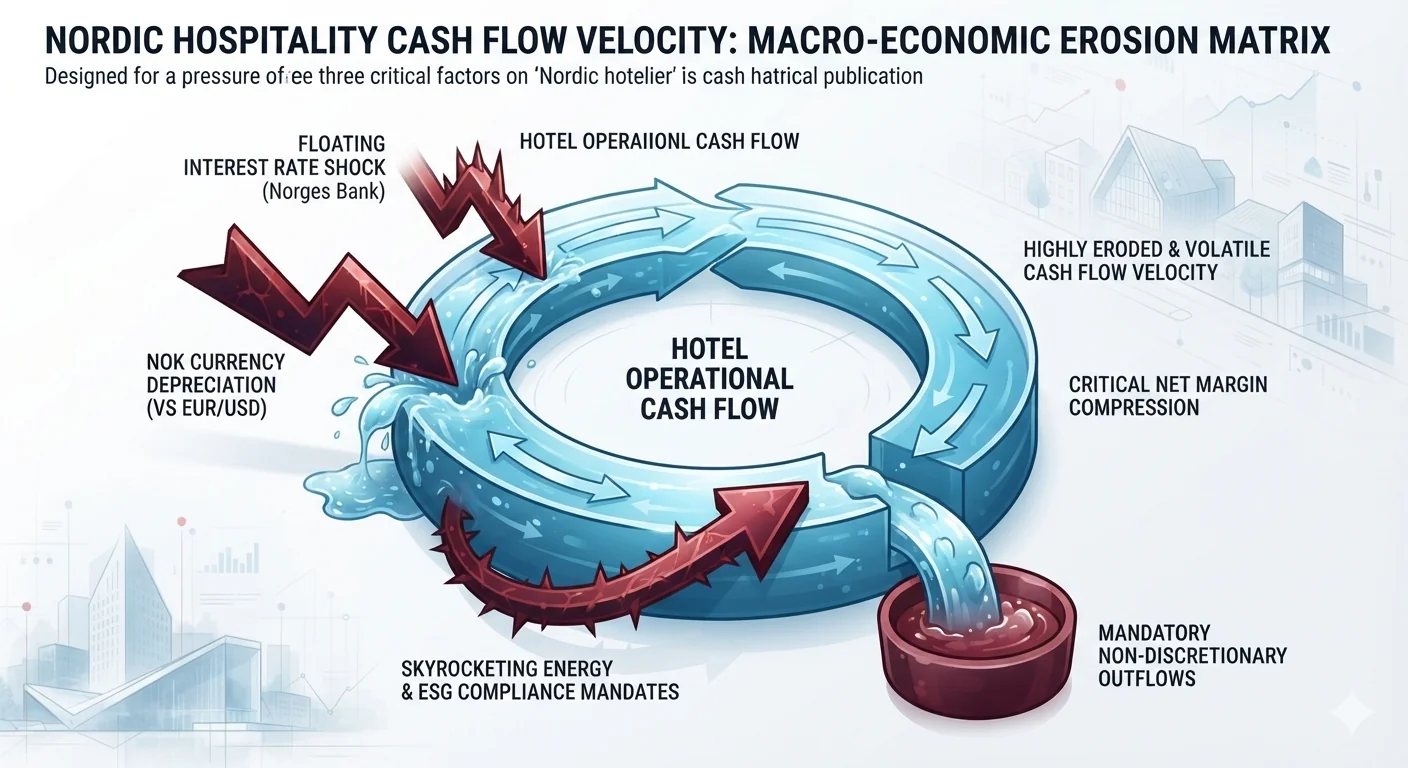
European hospitality is not losing demand, but revenue growth, profit conversion and capital return are decoupling. In a 2025 sample of more than 2,000 European hotels, RevPAR rose 3.1% and total revenue 3.3%, yet operating expenses rose 3.9%, payroll 5.7%, GOP margin fell 0.4 percentage points and only 23.5% of incremental revenue reached GOP. A hotel is simultaneously an operating company, a real-estate asset and a long-duration financing contract — and macro policy travels through all three balance sheets.
Can a company attract and retain capable people without always paying the highest salary? The Home Model answers by placing competitive pay, credible employment commitments, career autonomy and long-term trust in one governance framework. This essay builds the case with evidence: Statistics Canada shows 24.0% of the unemployed had searched at least 27 weeks (vs 17.1% in 2017–2019); a hiring experiment found workers give up ~20% of wages for predictable scheduling; Trip.com's hybrid-work trial cut attrition from 7.2% to 4.8% with no performance loss; and generative-AI studies show technology can raise worker capability rather than only replace headcount. The conclusion is disciplined: stability is not a substitute for fair pay or financial discipline, but a credible, deliverable commitment can turn it from a cost into a source of productive capacity.
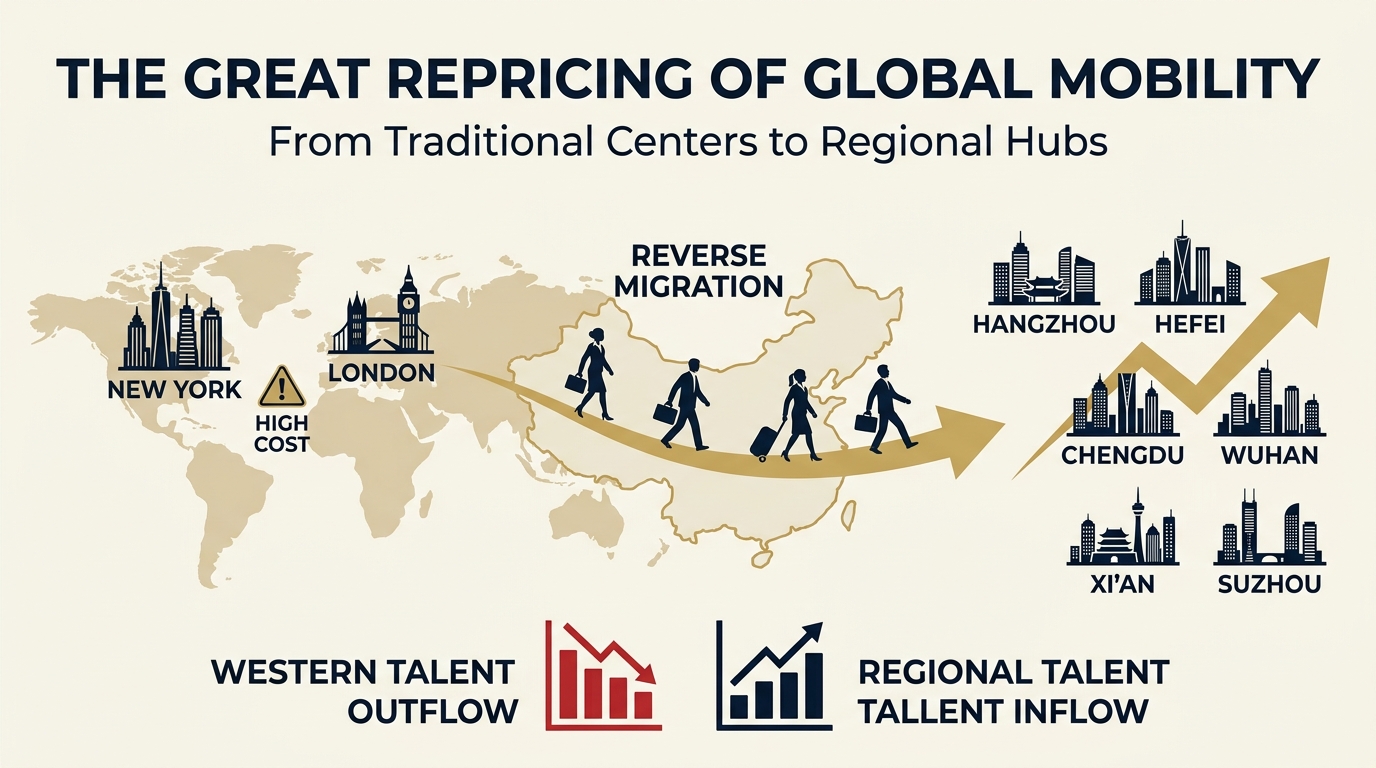
Migration is not ending — it is being repriced. As the income, career, and status premium once offered by traditional global centers narrows while housing, tax, and status costs rise, mobility does not stop; it changes direction. China's differentiated urban map — first-tier moderation alongside targeted gains in Hangzhou, Hefei, Chengdu, Wuhan, Xi'an, and Suzhou — offers an instructive mirror for a broader global pattern: an estimated 304 million international migrants in 2024, still near record levels but slowing, diversifying, and regionalizing. The real contest is no longer who can attract talent, but who can convert it into productivity through an institutional bridge of real jobs, research platforms, capital, affordable housing, and open culture. For nations, companies, cities, and individuals alike, the next era of mobility will be defined less by a handful of dream destinations than by portfolios of opportunity.
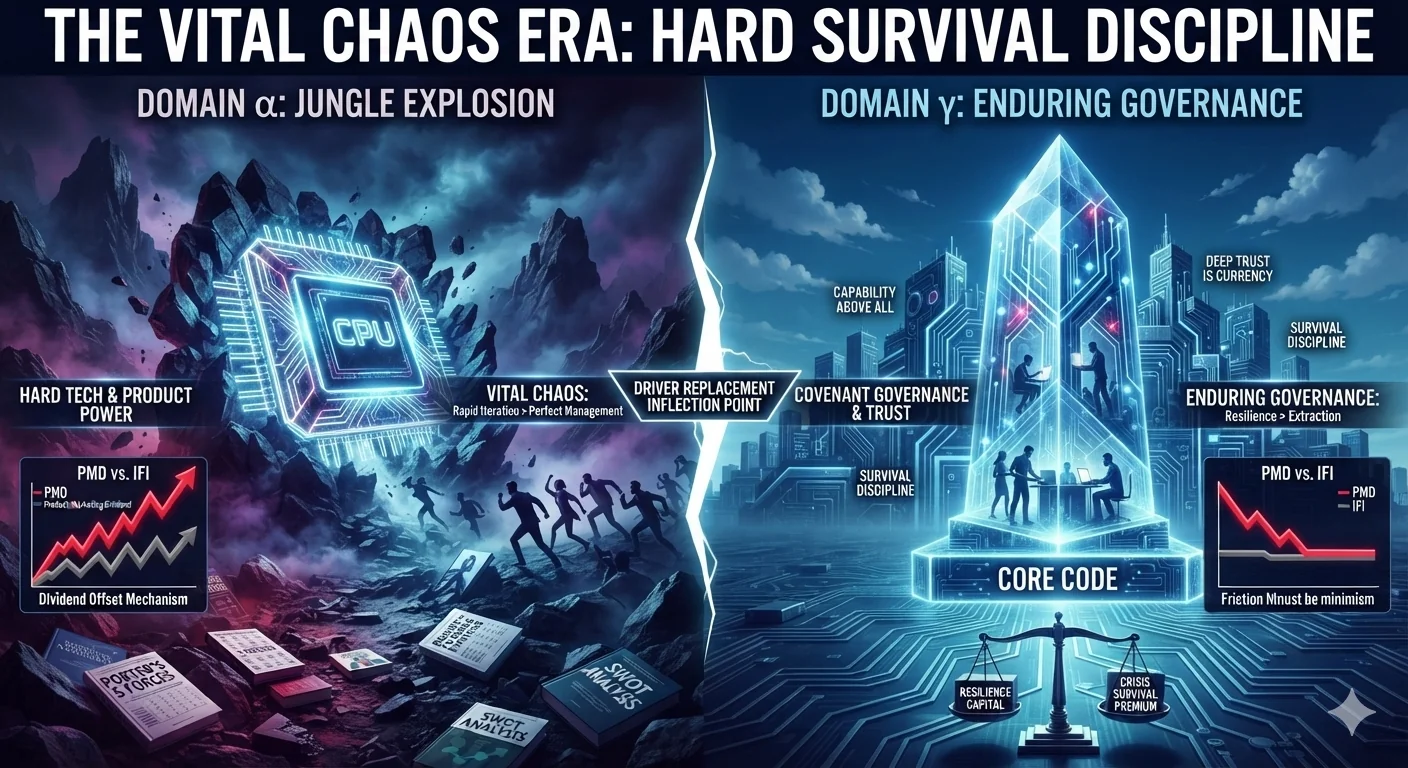
Taking Michael Porter's Monitor Group (bankrupt 2012) and the Nobel-laureate-staffed LTCM (imploded 1998) as hard cases, this essay proposes a stark criterion for management theory: the inability to sustain operations is the ultimate test. It develops the Dynamic Driver Replacement Theory (DDRT) — Domain α Jungle Explosion, the Driver Replacement Inflection Point, and Domain γ Enduring Governance — plus a covenant-governance framework distinguishing Performance UI from Core Code, and examines how AI-era commoditization of Performance UI sharpens the boundary between the two into a watershed of corporate survival.

Kenya set a tourism record in 2025 — 7.9 million visitors and $3.84 billion in revenue — yet the Maasai Mara is still run as an island business for the few, exemplified by the new 20-suite Ritz-Carlton camp at $3,500 per person per night. This blueprint proposes a Core–Periphery Zonation strategy: absolute protection of the ecological core, an 85%-optimal clustered build-out of roughly 255 resorts in the buffer zone, and zero-emission shuttle access — using tourism's industrial-scale cash flow as the lever that finally justifies highways, the national grid, and 5G across the ecosystem. All baseline figures are sourced; all projections are disclosed-assumption scenarios.

Dr. Tong Yin's September 7, 2026 essay — republished in full by HTrends — proposes a Core–Periphery Zonation strategy for Kenya: protect the Maasai Mara ecological core as an ultra-luxury 'crown jewel', cluster roughly 255 modern resorts in the migration-corridor-free buffer zone so shared highways, grid and telecom infrastructure become commercially viable, and let the resulting ~$4 billion regional cash flow unlock a leapfrog upgrade of national transport, power and connectivity — turning tourism from an island business for the few into the strategic lever for a nation's modernization.

Dr. Tong Yin's September 7, 2026 essay — republished in full by Hotel News Resource — proposes a Core–Periphery Zonation strategy for Kenya: protect the Maasai Mara ecological core as an ultra-luxury 'crown jewel', cluster roughly 255 modern resorts in the migration-corridor-free buffer zone so shared highways, grid and telecom infrastructure become commercially viable, and let the resulting ~$4 billion regional cash flow unlock a leapfrog upgrade of national transport, power and connectivity — turning tourism from an island business for the few into the strategic lever for a nation's modernization.
In an age when anyone can coin a concept, assemble a model, or package a method, “theory” has become one of the most overused words in intellectual life. A genuine theory does not win by appearing complicated or by multiplying terminology. It must penetrate appearances, reveal durable relationships, and retain explanatory and practical value as circumstances change.

Meta's $2 billion acquisition of Manus was formally vetoed by China's NDRC, and the entity spun off from the failed deal later forced users to back up or migrate their data while triggering mass refunds. Monica's split product then collapsed under connectivity errors and a freefall in intelligence. The episode exposed the true mass-market opportunity: a genuine AI Browser — a left-screen/right-sidebar copilot — now being squandered by trillion-dollar giants.
NVIDIA is worth more than three times Tesla — so why is Jensen Huang's fortune less than one-sixth of Elon Musk's? Using verified public data as of September 2026, this analysis reconstructs the full dilution bill of both founders: Huang's stake fell from 100% to 3.5% through three decades of venture financing and issuance, while Musk refused dilution after PayPal and kept ~13% of Tesla and ~42% of SpaceX. A counterfactual audit shows dilution cost Huang roughly $475 billion, and the June 2026 SpaceX IPO confirms the playbook: leverage capital early, self-fund late, and never let VCs own your destiny.
AI now holds knowledge at a scale no individual can match — yet the scale of knowledge is not the maturity of wisdom. This essay distinguishes computation, analysis, and wisdom as three levels of capability, and argues that the decisive test is not how much an AI knows but whether it can judge which information deserves trust, detect contradictions, and verify its own 'completed' work to a product-grade standard. It proposes a three-step framework — strip away identity, dissect the substance, audit the incentives — for interrogating claims in an age of declining trust, and concludes that the best future is not AI making decisions for humanity, but AI making the complex world clear enough for responsible people to make better ones.

A six-layer measurement framework separating personal exposure, employee usage, corporate procurement, production deployment and auditable financial return — covering 15 countries and 12 industries, with a dedicated fact-check of physical AI and hardware integration. Data as of 15 August 2026.
Dr. Tong Yin's August 2026 essay — first published on Hotel News Resource and syndicated the same day by NewsBreak — asks whether Türkiye's successful-but-low-margin model is sustainable: the 40% Western-European all-inclusive segment runs 3–5% net margins while TL deposits yield 44.4%. The proposed fix is seasonal price bifurcation: summer as a fixed-cost coverage engine, winter as a pure-profit engine targeting Gulf, Russian, medical and retiree extended-stay demand.
Dr. Tong Yin's August 4, 2026 essay — republished in full by hospitality media HTrends the same day — dissects how Türkiye rose to the world's fourth-most-visited country (60.6M arrivals, +21% vs 2019, $56.28B revenue) without iconic assets like Rome or the Louvre: a four-pillar state strategy of price-anchor positioning, both-ends-winning visitor sourcing, sovereign-scale aviation, and manufactured tourism assets.

China holds 5.32 million valid invention patents, yet only a fraction reach production. A dual-track reform — keeping neutral statutory examination while adding an optional, confidential validation-and-commercialization pathway — can turn patent volume into deployed innovation without turning examiners into investors.
China's private universities must answer why they exist, whom they serve, and who pays. Three clocks — regulation, the labor market, and demographics — plus tuition dependence and AI are forcing a structural re-sorting: some legacy forms wind down while research, applied, and vocational alternatives gain definition.
As capability gaps narrow to a thin band, the AI race's decisive frontier shifts from raw model intelligence to dependable, governable, cost-predictable work. Kimi K3, Claude, and OpenAI's model ladder show that cheap tokens do not automatically mean cheap work — the real moat is orchestration, routing, and reliability.

Türk denizcilik medyası Limandayız'ın, Dr. Tong Yin liderliğindeki "2027 AI × Küresel Otelcilik ve Turizm Beyaz Kitabı" hakkındaki haberi: yapay zekânın otelciliği dağıtım, operasyon ve veri egemenliği ekseninde yeniden şekillendireceği öngörüsü, üç katmanlı dönüşüm ve Türkiye için stratejik fırsatlar.
What Jiahui Yu's Exit from Meta Reveals About the AI Talent War — Meta's nine-figure recruiting campaign against OpenAI assembled a star team, yet Jiahui Yu left to found his own company a little over a year later. Money can buy a hire and a period of commitment, but never loyalty; home culture is what earns it.
A strategic essay on the structural liquidation of the legacy asset-light hardware regime. NVIDIA's vertically integrated, ecosystem-subsidized DGX Spark (GB10 Grace Blackwell Superchip, 128GB unified memory) is not a "computer" in the legacy sense but a localized execution engine for sovereign human judgment. It collapses the profit margins of third-party assemblers, strips the marketing facade from asset-light giants like Apple, and — through the iron law of economies of scale — positions NVIDIA to absorb the very advanced-manufacturing empires the old regime refused to build. Legacy skills are dead; the apex capability of the next decade is defining problems, auditing outputs, and executing razor-sharp corrections.
Does a nation's fate depend on its institutions or its leaders? Institutions are civilization's brakes—they preserve order, continuity, and dissent but cannot generate vision, courage, or historical responsibility. Leaders are its engines—they activate institutions, recognize turning points, and set the ceiling on how far a nation can rise. An advanced political order must do both at once: constrain power, and identify, develop, empower, and correct its leaders.
Vision 2030 has given Saudi Arabia one of the world's most ambitious hotel pipelines. The next challenge is no longer construction or branding — it is profitability. Dr. Tong Yin examines why strong occupancy does not automatically create owner returns, and what it takes to turn record demand into durable profit: pricing discipline, purpose-built operating models, AI that changes decisions rather than reports, and a long-term investor mindset.
Between a laboratory breakthrough and a productivity system embedded in society lies a conversion zone of capital, energy, institutions, user trust and public legitimacy. Leadership determines how efficiently that zone is crossed. Seven connected capabilities separate a civilizational helmsman from a mere operator.

As discovery fragments across platforms and AI interfaces, media advantage shifts from reach to usefulness: helping defined audiences select, verify and interpret — then converting that trust into durable relationships and diversified revenue.

Strategy is forward-looking judgment made before outcomes are certain. Malaysia's positioning on the One China question is a bounded, issue-specific alignment nested inside broader hedging — not a rupture, but a testable commitment with explicit costs.
When a nation's most resource-rich companies lose the will to enter unexplored territory, who assumes the risk of pushing the frontier forward? The danger is not that Big Tech stops researching — it is that innovation mutates from creating new markets into defending old ones, from cannibalizing one's own products into prolonging their commercial life. The essay dissects the founder-versus-manager risk asymmetry, the corporate 'immune system' that filters out breakthroughs, and monopoly's sedation of urgency — then turns to Huawei as the counter-case: external constraint reactivating entrepreneurial organization (114,000 R&D staff, 53.7% of workforce; RMB 192.3B R&D spend, 21.8% of revenue; intelligent-vehicle solutions +72.1% YoY in 2025). It closes with five institutional designs for preserving founder's spirit after the founder departs — and why disciplined competition is civilization's first line of defense against stagnation.
As Western markets close and trade barriers proliferate, the three export-oriented economies of East Asia — China, Japan, and South Korea — face a shared structural risk: Japan's high-end technology lacks absorptive markets in Southeast Asia and India; China's vast industrial capacity needs quality outlets it cannot find under containment; Korea's export dependence remains exposed. The essay argues that the deadlock is not primarily a product of subjective hostility but of institutional inertia, hereditary political constraints, and a public-opinion spiral that marginalizes bridge-building politicians. Drawing on the Franco-German reconciliation precedent — where ceding partial sovereignty over coal and steel made war structurally impossible — it calls for treating the three neighbors as each other's primary regional core market before all three drift into 'economic island' isolation.

The yen's violent swings are not an ordinary FX episode. They expose four interlocking problems: the tension between monetary policy and fiscal constraint, the rewiring of exchange-rate transmission by globalized supply chains, how national interest reshapes market pricing, and the boundary where traditional trade theory stops explaining reality. From the July 31, 2026 coordinated Japan–US FX action to interest-rate differentials, this long-read ends with a defined-risk toolkit smaller investors can actually execute.
Three markets are funding the current luxury hotel investment wave with three very different kinds of capital: return-seeking private capital in Europe, sovereign equity from Saudi Arabia's PIF, and land-condition-bound state enterprise capital in China. Drawing only on public disclosures and institutional reports, this piece asks two financial questions — who supplies the money, and who absorbs the loss when returns fall short — and finds one disclosure pattern running through all three markets.
The methodological cornerstone of Dr. Tong Yin's strategic-intelligence system. In an environment where technology paradigm shifts, geopolitical realignment, capital cycles, and supply-chain restructuring happen simultaneously and coupled, the primary cognitive risk is not too little information but information chopped into sealed compartments. Holographic and Dynamic Thinking integrates variables scattered across dimensions and time scales into one interrelated picture — and revises that picture in real time as the environment moves. The essay defines the two traits (holographic integration, dynamic recalibration), dissects the four-step operating mechanism (broad-spectrum intake, cross-dimensional recombination, scenario stress-testing, real-time recalibration), gives three structural reasons it is indispensable, maps individual and organizational cultivation paths, and warns against three misuses: over-reaction, pseudo-holography, and vacillation in the name of dynamism.
A case study in breakout strategic innovation. Confronted by twin constraints — export controls closing key markets to its most advanced chips, and the closed-source model camp's cloud-API software moat — Jensen Huang chose neither retreat nor compromise. Three interlocking moves rebuilt NVIDIA's position: system recomposition (selling whole AI computers instead of components), open-source compression (Nemotron 3.5 driving the software premium toward zero), and precision positioning on data-sovereignty and security — the two red lines global enterprises care about most. The result is a self-reinforcing loop: geopolitical red lines create local-deployment demand, free models and routing tools seed a global developer ecosystem, and the profit center stays welded to the hardware layer where NVIDIA holds absolute advantage — plus first-mover positioning for the sovereign AI decade.
On the historical path, methodological failure, and future direction of economics and business scholarship. From Adam Smith to Keynes the study of wealth was political economy — anchored in real-world dynamics, institutions, and power. The mid-20th-century 'physics envy' axiomatic turn traded truth for solvability; business schools inherited the formalist closed loop. The foundational flaw is a category error: linear tools applied to complex adaptive systems, confusing measurable risk with Knightian uncertainty. Generative AI delivers the external coup de grâce — compressing the marginal cost of technical execution to zero and destroying the legitimacy of tool-mastery doctoral training. The reconstructed discipline shifts from equilibrium physics to complexity science, adopts the engineering standard of epistemic action and hard deliverables, and reunites top-level governance with technical architecture — completing the great return from the closed loop of publication to the power of real-world construction.
Nearly three years after ChatGPT lit the fuse, the generative-AI frenzy faces its reckoning. Pure-play foundation-model unicorns run an anti-commercial structure — zero cash-cow businesses, 100% dependence on external transfusions — and their endgame is harvest by incumbents whose legacy profits (Windows/Office/Azure, advertising) fund the war. Managerial juvenility compounds it: lab-mindset arrogance, political narrative over unit economics, and — most damning — Anthropic's unilateral surrender to the EU AI Act's Article 50 global-watermark regime at the exact moment the U.S. industry needed a united front. The survivors of the cleansing will be restrained, pragmatic toolchains that respect user sovereignty and deliver end-to-end value. A companion to the Top Strategy Series (Subduing Without Fighting · Preemptive Strike · Industrial Nirvana).
A strategic research monograph: the four-decade era of hyper-globalization is closing structurally, not cyclically — cross-border capital, production, raw materials and human capital are being severed simultaneously. With the effective U.S. tariff on Chinese goods at 23–33% (ten times the 2017 baseline) and origin-conversion enforcement systematized, the 'China+1' escape route is failing. Capital, capacity and orders are forced back into the domestic market, triggering an elimination round of extreme intensity: giants consolidate, small and mid-sized firms exit en masse, and the industrial structure completes a qualitative leap. The final chapter answers what firms can do now — why offense is the best defense, why home-model culture matters most in the long winter, and why the industrial army that survives the elimination round will go global with crushing superiority when the pendulum swings back. Third part of the Top Strategy Series, with 'Subduing Without Fighting' and 'Preemptive Strike'.
An integrated long-form doctrine: why pure defense is slow suicide in an era of technological paradigm shifts. Covers the three offensive pillars — aggressive market expansion, self-cannibalizing R&D, and weaponized technological barriers — with case studies from Apple's abandoned Project Titan vs. the Tesla/BYD ecosystem stranglehold, Nokia's Symbian collapse, Intel's decline, and the Kodak-Nokia-BlackBerry graveyard. Includes an offensive-vs-defensive metrics matrix and a board-ready memo template for institutionalizing an offensive corporate operating system.
Three documented executions of model worship — 96.7% of 153 recessions missed a year out, LTCM's $4.6B loss inside an event its own model priced once every 80 trillion years, and Greenspan's under-oath "I found a flaw" — dismantle the illusion that AI plus historical data equals foresight. What sovereign-fund and ministry decision-makers need instead is a temple-grade cognitive architecture: three cognitive axes (time, space, depth) and four operational disciplines that draw the boundary between what the model may own and what only human judgment may enter.
Four case studies, one framework, and now the verdict. The final installment of the Precision Immigration Governance series puts Australia, Germany, Singapore, the United States, and Canada on a single scorecard — selection precision, intake calibration, capacity integration, execution — and answers the anchor essay's closing question: what would a G20 country that actually governed migration like an operating system look like? The answer is not Singapore (unexportable) and not America (a 1990 time capsule). It is the federation that in October 2024 did something no G7 government had ever done: cut its permanent-resident target by a fifth, capped temporary residents in the same plan, anchored the system to an explicit population ratio, and projected a deliberate 0.2% population decline — in public, with numbers, on an annual cycle. Canada is the closest thing on earth to a scalable immigration operating system. Here is the evidence, the grades, and the five lessons.
Australia never connected its selection machine to capacity. Germany cannot execute its own design. Singapore calibrates annually by spreadsheet. The United States — the strongest talent magnet on earth — froze its core immigration parameters in 1990 and has since let courts, lobbyists, fraud, and illegality do the calibrating instead. Part 4 of the Precision Immigration Governance series dissects the 65,000 H-1B cap that survived the internet era, the 1.3-million-person green-card backlog, and the belated, chaotic arrival of price signals: the beneficiary-centric lottery, the $100,000 fee now ping-ponging through federal courts, and the wage-weighted selection rule effective February 2026. The cautionary case that proves the anchor framework by violating every one of its terms.
Australia built a superb selection machine but no intake gate. Germany designed an A-minus machine executed at C-plus. Singapore did something categorically different: it turned immigration into a continuously calibrated operating system — wage-indexed salary gates, a 40-point COMPASS score that prices firm-level externalities, and levies plus ratio caps that make carrying capacity an engineering parameter rather than a political slogan. Part 3 of the Precision Immigration Governance series examines the closest real-world implementation of the anchor framework's 85% safety coefficient — and asks what larger states can and cannot copy.
In 2000 Germany still insisted it was 'not an immigration country.' By June 2024 it had launched the Chancenkarte — a points-based jobseeker visa that no other large European economy dared to build. The two-layer system (EU Blue Card + Opportunity Card) is the most deliberately engineered skilled-migration architecture in Europe. The open question is whether sixteen-state execution and the recognition bottleneck will hollow out the precision on paper.
Australia built the world's most refined skilled-migration selection machine — and still repeated Canada's pendulum error in 2022–2024, when net overseas migration hit 518,000 while housing completions fell 27% below target pace. The lesson: a precise entrance is only half the system. Without a carrying-capacity gate, even the best points test fails.
Mid-scale hotels face a structural crisis no algorithm can solve alone: 70–80% annual frontline turnover. AI fixes processes; it does not fix people. This essay argues for a dual-track path — lightweight, externally-clipped AI to stop the financial bleeding, paired with The Home Model Culture, a framework for retaining staff through stability, career paths, time-investment, and dignity when you cannot pay the highest cash wage. Technology smooths the road; culture decides where the journey goes.
A constructive look at how AI is repricing service work in hospitality. Instead of replacing people, AI is redrawing the line between back-of-house and front-of-house, contracting headcount at the entry level while raising wages and skill expectations for the roles that remain. Field observations from properties running 18+ months of mature AI-assisted operations: payroll down 4-8 points, frontline wages up 18-30%, voluntary attrition down by a third. The industry's next decade belongs to operators who treat the "presence layer" as where the brand actually lives — not as the cheap layer.
Over the coming years, the U.S. hotel sector may not simply move through another conventional cycle — it may experience a gradual but meaningful structural divide. Three distinct operating models are emerging: family-labour micro-lodging at one end, mid-scale traditional assets squeezed in the middle, and capital-strong systems operators redesigning the stack at the other end. In the near term, AI matters most as the operating brain, not the mechanical body. Restrained, analytical, and built for owners deciding where their asset sits.
GDP figures soar while living standards decline; universities produce more graduates than ever, yet employers describe a catastrophic talent shortage; organizations are stuffed with 'leaders' but genuine leadership has become extinct. Welcome to the Tyranny of Mediocrity — a world where the greatest talent is the ability to be unremarkable. From Lincoln to FDR to Churchill to Wang Anshi and Tan Sitong, from Elon Musk to Steve Jobs, history delivers a damning verdict: systems only turn to heroes at the edge of extinction. A manifesto for the edge, and the 45-fold Survival Premium of Core Code over Performance UI.
Companion and forward-looking extension to Dr. Tong Yin's July 2026 essay on Türkiye's tourism ascent. Proposes a deliberate strategic repositioning — from the current volume-based European mass-market all-inclusive model (3-5% net margins, effectively zero real return under Türkiye's 37% policy rate) toward a seasonally bifurcated dual-track model: summer as a fixed-cost coverage engine serving European middle-class packages, winter as a pure-profit engine serving Russian, Gulf, medical tourism, and Western HNW retirees. Combined with direct-booking revenue management, the same physical assets multiply annual net profit ~5x on a 300-room Antalya resort simulation.
How Türkiye rose to become the world's fourth most-visited country — and what its rise teaches every other nation about winning in the post-globalization era. 60.6 million international arrivals, $56.28 billion in tourism revenue, +21% growth since 2019 — the empirical outcome of a coordinated four-pillar national strategy (price-anchor positioning, geopolitical both-ends sourcing, sovereign-scale aviation, and the deliberate industrial construction of manufactured tourism assets).
InsightBridge Global Intelligence 2027 Beyaz Kitabı'nın Türkçe özet versiyonu — Türk turizm okurları için özel hazırlanmış kapsamlı analiz. Beş temel yargı, dört bölgesel trajektori ve Türk turizmi için üç doğrudan stratejik uygulama. İkinci monthly column · Turizm Günlüğü Ağustos 2026 sayısı için Genel Yayın Yönetmeni Yaşar Bey'in davetiyle hazırlanmıştır.
For most companies the central AI question is not how to reach the technical frontier, but which commercial architecture they can realistically sustain. This note distinguishes three commercialization paths now visible in the global market — the capital-intensive frontier bet, the ecosystem-embedded utility, and the B2B technical wholesale — and the geopolitical and unit-economic constraints that quietly determine which path is open to whom.
A new archetype in Dr. Tong Yin's continuing series on the human capital behind industrial transformation: the Technology Strategist — a rare founder-operator who simultaneously grasps a technology's first principles, reads a decade of industrial rhythm, and bets the company on that understanding against overwhelming opposition and terrible short-term financials. Three living case studies — Ren Zhengfei's 2004-launched HiSilicon and 2012 Laboratories spare-tire program (CNY 1.249T cumulative R&D over ten years, 54.1% R&D workforce), Jensen Huang's lonely 2006 decision to force CUDA into every GeForce card (surviving a market-cap collapse from $8B to $1.5B en route to today's AI moat), and Morris Chang's 1987 pure-foundry bet on TSMC ($90B revenue, $1T market cap, 90%+ share of advanced nodes) — argue that what decides the fate of a high-tech company over a decade is almost never its org chart. It is the counter-intuitive judgment of one or two founders. Bain's 25-year study confirms it: founder-led public companies have delivered 3x the shareholder returns of others since 1990.

A twenty-five-century-old deterrence philosophy, redefined for the age of AI, quantum computing, advanced semiconductors, and full-spectrum industrial integration — and its structural implications for national security, capital allocation, and civilizational continuity. Sun Tzu's supreme dictum — 'to subdue the enemy without fighting' — is not diplomatic rhetoric; it is actuarial realism. Reformulated here as a five-act arc (Definition · History · Modernization · 2026 High-Tech Doctrine · Future) and cast into five simultaneously-updating deterrence nodes: millisecond-scale AI OODA loops, quantum encryption asymmetry, leading-edge semiconductor and compute-sovereignty control, LEO-and-swarm resilience that nullifies decapitation, and the energy-matter-information cost revolution.
In an era of violent reversal, how should an enterprise formulate its strategy? Using New Oriental's pivot from after-school education into cultural tourism as a mirror — not to judge, but to illuminate the principles too often overlooked. Five disciplines: capability over tailwind; respect for the asset-structure of the value chain; reverence for common sense; ambition matched to true market capacity; and grayscale testing as the guardrail that lets ambition travel far. Strategy returns from grand narrative to core capability and the humility to correct course.
Reading the June 2026 news cycle — a frontier-AI compliance notice, parallel industrial-policy programmes for semiconductor capacity in multiple jurisdictions, evolving export rules, and the convergence of foreign-investment screening — as a single signal rather than a sequence of unrelated events. Across very different economies, the relationship between large technology companies and the states that host them is being rewritten at the same time, in the same direction, with remarkably similar instruments. The companies that respond well treat compliance, governance and external transparency as core product, not overhead. The most valuable technology companies of the next decade will be the ones that earn permission to operate at the frontier in this new environment.
Solid-state batteries have been reduced to a one-dimensional race — 'who gets there first, China or Japan?' The real contest is between laboratory-patent economics and factory-floor iteration economics. Toyota holds 1,300+ patents on sulfide all-solid-state; CATL, BYD, Qingtao, and WeLion have already put imperfect-but-functional semi-/quasi-solid batteries into millions of vehicles. This piece decodes the three physical bottlenecks (solid-solid interface, dendrites, cost curve), the industrial-governance chasm behind them, and the structural echo with Japan's hydrogen fuel-cell misfire a decade ago.
Singapore's current prosperity is a 'beta-type prosperity' built on the assumed irreplaceability of the Malacca Strait. Once that assumption is diluted by Arctic route commercialization, Singapore faces not simply slower growth — but a re-rating of national position. NSR volumes hit 37.9M tonnes in 2024; transit voyages up 6.2% YoY; Rosatom projects 150M tonnes by 2035. A three-layer analysis of what today's 4,200 multinational HQs, record throughput, and US$2B Manus acquisition are really telling us about the next 15–25 years.
Between May 13 and July 14, Dr. Tong Yin published a sequence arguing Saudi Arabia's Vision 2030 ultra-luxury tourism program faced a structural — not cyclical — mismatch. Within 4–8 weeks GASTAT, JLL, PIF and NEOM confirmed every headline prediction: ADR −11.4%, Riyadh occupancy −13.5pp, Makkah RevPAR +39%, The Line deferred to 2030 with $8B written off, PIF earmarks $16B for contract terminations. A public scorecard.
Vision 2030 backed by the world's most expensive consultants, the region's largest sovereign wealth fund, and its most concentrated political will is showing systemic strain only a few years into execution. The reason is not insufficient investment — it is a strategy that violated several basic principles of market economics and cultural realism. Four structural mismatches, four failing paths, and three transferable lessons for any national or corporate transformation.
By 2026, generative AI can flawlessly simulate executive polish — refined communication, immaculate KPI attainment, empathetic public speeches. Every traditional metric a board uses to select a CEO can now be technically manipulated or enhanced. Yet new-CEO failure rates remain punishing: 40% within 18 months, and mishandled executive transitions destroy ~$1 trillion of market cap annually across the S&P 1500. The root cause is what Dr. Yin calls the 'bureaucratic-interface bias' — institutionalized selection processes that systematically reward high-camouflage personalities while filtering out moral courage, independent judgment, and the willingness to challenge authority. This essay proposes a 'Penetrating Character Audit' framework — bypassing the performance interface to identify leaders who defend the organization as their own home rather than as a paycheck — with a documented 45× cost advantage in crisis (a comparative study of two mid-cap electronics manufacturers during the 2024–25 downturn: $180K coordination cost vs $8.2M in legal/severance/rehire/knowledge losses).
A long-read analysis on how deglobalization, regionalization, and data sovereignty are reshaping global tourism and hotels. Two-tier international travel, asset-light hotel chains converting into federated regional operators, demand pillars (corporate / VFR / premium leisure) all rewriting at once, and five competencies operators need to compete on depth rather than borderless reach.
Between 2022 and 2026, Russian-speaking outbound travel reorganised faster than almost any source-market shift in modern tourism. Russia is now a year-round top-five UAE inbound source; Kazakhstan, Uzbekistan and Azerbaijan have entered top-ten GCC corridors. Average length of stay is 6.8–7.4 nights (vs European 3.9), and spend-per-night sits within 8% of US/UK at upscale/luxury tiers. Yet most underwriting still treats this as 'seasonal upside' rather than structural base load. The localisation gap — Russian-language SEO, Yandex Travel AI visibility, Telegram travel curator relationships, Mir/UnionPay acceptance — is a defensible 12–18-month moat for operators who move first. The cheapest major source market still available.
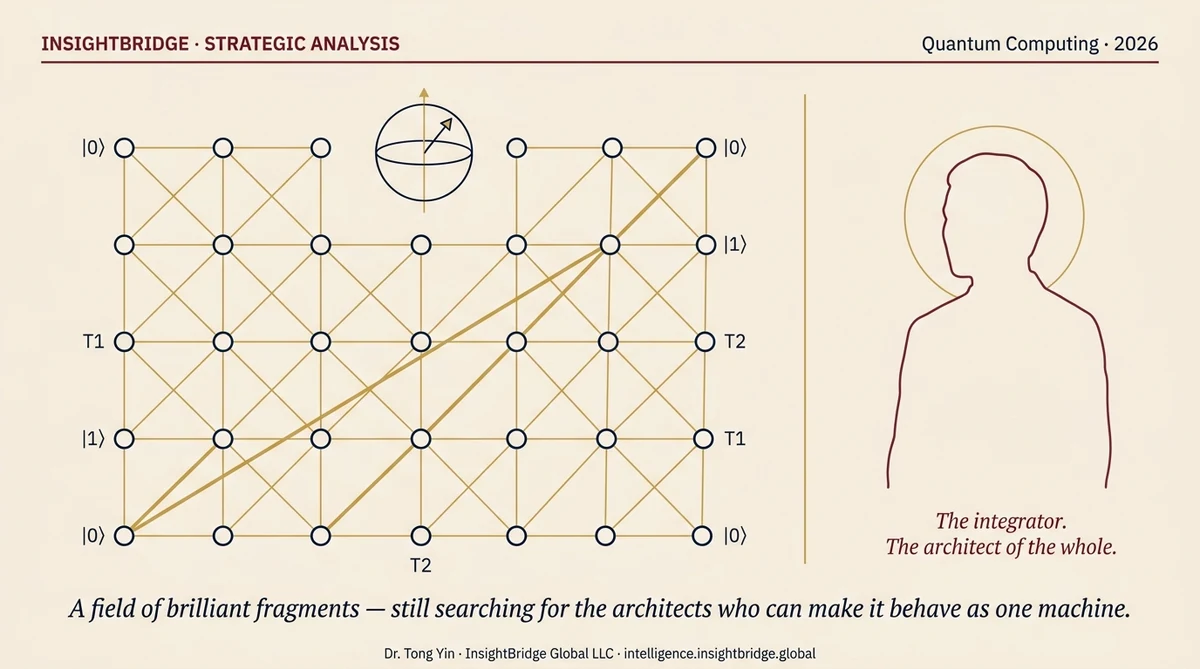
A neutral mid-year reading of quantum computing in 2026 — across four hardware paradigms (superconducting, photonic, trapped ion, silicon spin), the quiet power of open-source software ecosystems, and a supply chain that is becoming more localised across multiple jurisdictions. The most important constraint on the field today is not capital, chips, or export rules — it is human. Quantum computing sits at the intersection of at least six demanding disciplines, and today's academic and industrial career structures are not yet producing many system-level architects — the rare individuals (in the spirit of Oppenheimer or Qian Xuesen) who can hold all six in one head and integrate the field as one coherent machine.
A defensible technical definition of the AI-native hotel category. Three tests, drawn before incumbent chains capture the term as marketing language.
Three industrial densities converge at the West Artificial Island — robotics manufacturing, hospitality operations, state-supported infrastructure. The Pearl River Delta as a new center of hospitality innovation.
Bottom-up modeling of the labor economics of a full-scenario robot-serviced hotel. Realistic substitution rates, the 6–11pp margin range, and what it means for asset underwriting.
An operator-facing translation of PuduFM 1.0, PuduAgent, Vision-Language-Action and 3D spatial reasoning — what each actually means inside a working hotel.
Hotel pricing has been reduced to an algorithm race — deep learning, reinforcement learning, hourly auto-repricing. But the real question for executives accountable for P&L is not how sophisticated a model sounds. It is whether it improves revenue in a complex, constrained, highly variable environment in a way that is stable, controllable, and commercially meaningful. A serious pricing architecture has three layers: event detection as forward radar, operations-research optimization as the core, and managerial judgment as the boundary. Stability, interpretability, and execution quality — not the illusion of full automation.
Most public debate frames population growth as friction — housing, congestion, services. For small and mid-sized states, the more consequential and more easily ignored question is the cost of under-population: thinner markets, less industrial depth, narrower fiscal capacity, and a lower ceiling on national capability. The Swiss 2026 referendum and Australia's 'Big Australia' debate illustrate two sides of the same structural fact, and why an 'optimal population range' is a more useful framing than either demographic enthusiasm or demographic anxiety.
Hotels don't suffer from too little technology; they suffer from too many disconnected systems. PMS, RMS, CRM, channel manager, guest messaging, POS — each vendor competes for the operator's attention, none for their outcome. This piece describes what an integrated operating loop should look like, and why fragmentation is the industry's largest silent cost.
Over the past five years, immigration policy across advanced economies has staged the most undignified pendulum failure in modern governance. Canada ran its permanent-resident target above 500,000 while pushing non-permanent residents to 7.35% of population (~3M people); when housing, healthcare and public services buckled, the same government slashed 2026 PR targets to 380,000 (-24%), new temporary residents from 673,650 to 385,000 (-43%), and international students from 305,900 to 155,000 (-49%) in a single year — with not one intermediate step grounded in a carrying-capacity analysis. Europe, Japan and Korea sit at the mirror extreme, refusing structured intake despite acute demographic decline. Dr. Yin proposes a three-pillar engineering framework: (1) a dynamic comprehensive carrying-capacity ceiling; (2) an 85% Taguchi-style robust-design safety coefficient; (3) precision channeling by industry, region, institution and legal status — anchored by real fiscal windows (zero personal income tax for 5 years, zero-to-low corporate tax for 5–10 years in priority zones), region-linked federal benefits, and infrastructure ahead of quotas.
An observational essay that begins with the relatively small supermarkets of Norway and widens, step by step, into an analysis of the Nordic welfare-and-wage model, the capital discipline of Norway's $2.2 trillion sovereign wealth fund, the structural features of a lower-growth global environment, and a long-cycle view of adjustment and the next round of growth. The tone is deliberately restrained — descriptive, not predictive.
The $366 billion global leadership development industry faces an existential reckoning. 90% of employers find MBA hires lack the skills to succeed immediately — a $1 trillion annual failure in C-suite transitions alone. Business schools have become extraordinarily efficient at producing 'Performance UI' — the polished user interface of leadership — while systematically failing to develop 'Core Code': moral courage, independent judgment, and crisis resilience. Comparative research reveals a 45-fold Survival Premium of authentic leadership over performed competence. A reform agenda for the AI age.
Marriott alone booked 114 luxury deals and 15,301 keys in 2025, a record year. Beneath the 'premium resilience' narrative lies a carefully packaged margin illusion — the risk is not borne by branded operators. It is borne by owners around the world. A structural analysis of cost per key, occupancy math, and the asset-light contract machinery — plus three concrete clauses every owner should demand before signing.
Eurostat, UN Tourism, GASTAT, IMF and SURS data now converge on the same conclusion: global ultra-luxury hotel supply has decoupled from organic demand. Bulgaria occupancy at 27.7%, Saudi ADR down 11.4% YoY to SR423, PIF facing US$16B in project liquidation costs, while Marriott adds nearly 60,000 luxury keys through a fee-driven asset-light model that immunizes brands from local losses.
Technology can ignite a company; leadership decides whether it compounds. A bilingual long-read on biography, cap-table honesty, the technocrat's trap, talent-placement as the real founder job, and the platform-vs-vertical archetypes — drawn from cross-sector advisory work across tourism, hospitality, AI and cloud.
In May 2019, the Entity List should have ended Huawei in 18 months. Six years later, the company has completed arguably the most extraordinary strategic pivot in modern corporate history — from an overseas-market telecom giant to a China-anchored technology conglomerate led by intelligent vehicles and industrial AI. This long read decodes Ren Zhengfei's three career bets, Huawei's three organizational pillars (Legion warfare, Red-Blue backup, HR Committee), and why Western incumbents wearing 'glass slippers' of legacy profits cannot execute the same turn — plus three transferable lessons for global decision-makers.
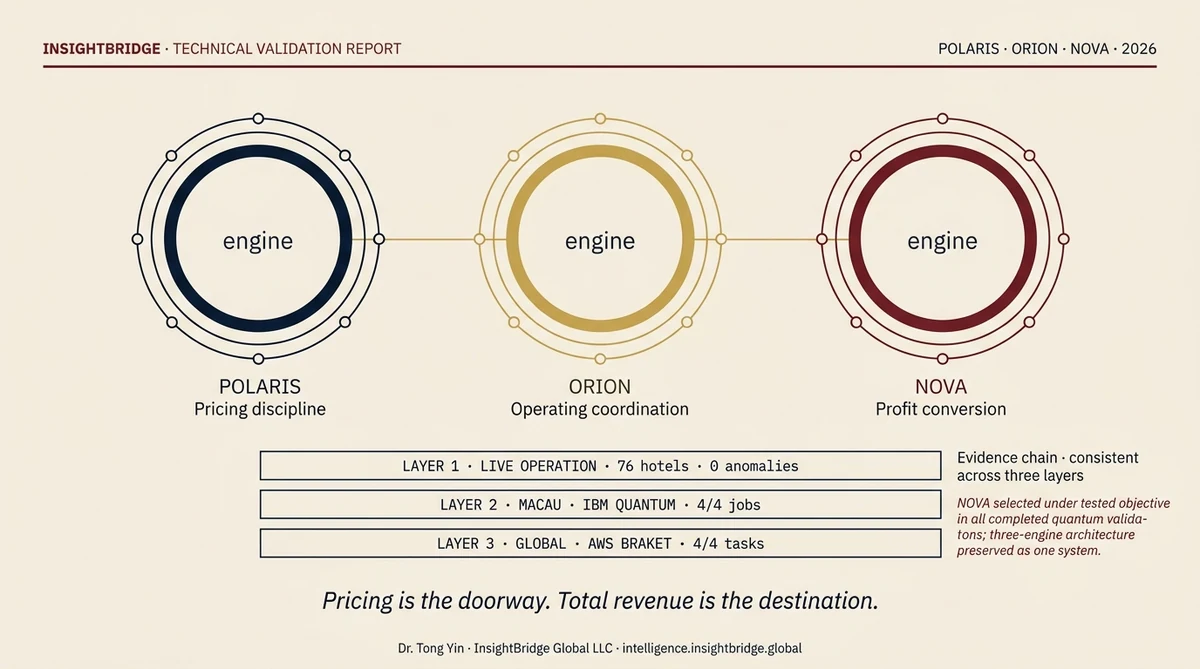
The platform should not be read as a standalone room-price optimiser. It is a total-revenue optimisation system. Across two completed quantum-validation tracks — Macau on IBM Quantum and a global hotel dataset on AWS Braket — NOVA was selected as the strongest single model in all 8 completed jobs. The full 24-page report (PDF) below.
On January 27, 2025, DeepSeek released a free, open-source LLM and wiped $589B off Nvidia's market cap in a single session — the largest single-day cap loss in stock-market history. The lesson was not technical; it was structural: incumbents with high valuations and quarterly revenue obligations cannot follow a competitor willing to absorb short-term loss for long-term positioning. The identical setup now exists in hotel revenue management. Duetto, IDeaS, Oracle OPERA and SAP are structurally incapable of offering a free two-month trial with profit-aligned pricing — the very model new patient-capital entrants like InsightBridge's Constellation™ suite (POLARIS™ · NOVA™ · ORION™) / Constellation system (POLARIS · NOVA · ORION) are built around. The mid-market — 70-80% of US hotels currently underserved — is up for grabs.
Part 5 of 5 · Finale. Two categories of risk resource-rich states face today, why diversifying the FORMS of holdings (not just the tickers) matters more than ever, the case for multi-region exposure beyond the Atlantic axis, and the three principles that close the series: domestic real strength as anchor, selective global participation as extension, diversified forms and locations as optionality.
Part 4 of 5 · For nations whose domestic absorptive capacity is bounded, sovereign capital can be repositioned from passive portfolio investor to active participant inside global industrial ecosystems. Three layers of strategic participation (mapping, governance, networks), and why asset and capability must grow together.
Part 3 of 5 · From Capital to Capability. A practical lens for resource-rich nations: beyond returns and risk, what is the domestic economy's capacity to absorb and build upon strategic investments? Building around water, logistics, clean energy and digital foundations; balancing employment-intensive and capability-incubating sectors; making sovereign capital a catalyst for capability growth, not just asset accumulation.
Part 2 of 5 · Tourism is a legitimate diversification axis — rarely a sufficient one. Why resource-rich nations gravitate to high-end hospitality, three structural risks (capital intensity, shifting visitor mix, supply outrunning ecosystem), and the case for treating tourism as a multiplier embedded in a broader capability ecosystem rather than as a single bet.
Series opener · A weekly five-part editorial. Resource-rich nations face a generational question: how to convert sovereign capital into sustainable industrial capability. This first essay contrasts two development patterns — "Purchased Modernity" (relying on external consultancies and multinationals to compress build-out time) and "Built Modernity" (embedding learning and capability within domestic firms and institutions). Finding the right balance is the central strategic question of the coming decade for resource-based economies. Next week (Part 2): Tourism and High-End Services.
Most hotel revenue management systems are built on three broken architectural assumptions — stable historical demand, clearly defined competitor sets, OTA-driven pricing signals — all increasingly invalid in 2026. Hotels deploying systems on these outdated assumptions may leave 8–14% of revenue on the table annually. The fix is a three-layer architecture: demand reconstruction from first principles, channel-aware net revenue optimization, and human-in-the-loop learning systems where every override becomes a training signal. As travel discovery migrates from Google to ChatGPT, Gemini and Perplexity, hotels with better data, better content, and adaptive pricing will be recommended ahead of OTAs — intelligence advantage becomes the new distribution moat.
In 2026, Silicon Valley executives take turns proclaiming that AGI is about to rewrite everything. Wall Street buys the story; valuations soar. But strip away the smoke, and two cold sets of facts emerge: (1) OpenAI's 2025 operating loss was $20.9B and its 2026 loss is projected to widen to a $14B cash / $25B GAAP hit while the four hyperscalers together will spend $725B on AI capex in 2026 (+77% YoY, none has recovered its costs); (2) MIT shows 95% of enterprise AI pilots produced no P&L impact, S&P Global shows 46% of projects were killed before production, Gartner shows 85% of CX AI systems are being dismantled. This piece unpacks the mercenary-scientist mechanic behind the $100M contracts, the shovel-seller math that funnels every downstream dollar into Nvidia's checking account, and the 85% accuracy ceiling that makes industrialization impossible under the current Transformer paradigm.
Autonomous travel agents are moving the demand-capture layer of the global travel industry from information aggregation to decision agency. The industry's traditional 10–25% OTA commission structure is being repriced into a two-tier 'quality gate + differentiated ranking' model, while travel data localization is producing a dual-track ecosystem — cross-border and locally integrated — that global hotel groups will need to serve simultaneously.
InsightBridge Global's 2027 outlook synthesizes fifty-plus original research pieces into an integrated framework spanning three simultaneously reorganizing layers of hospitality: the Agent Layer (demand capture), the Physical Layer (embodied AI and robotics), and the Sovereignty Layer (data localization). Five headline judgments and an 8-participant × 3-horizon strategic matrix.
Vision 2030 delivered the demand. The next chapter is about converting that demand into durable owner returns — a discipline built on operating-model design, segmentation, distribution architecture, AI in decisions (not dashboards), and long-term owner-operator alignment. Originally published as a Special Report in Hospitality News Middle East, Issue 158.
Hotels in Southeast Asia pay up to 28% in hidden OTA fees beyond headline commissions. A five-step playbook — audit, direct-booking funnel rebuild, intelligent paid acquisition, OTA renegotiation, and guest data sovereignty — that shifts a property from 12% direct share to 30-45% within 24 months.
The next advantage in hospitality will come from judgment, not automation. Middle managers — not vendors or executives — decide whether AI recommendations become part of the daily operating rhythm or remain an unused dashboard. Culture, not code, is the differentiator.
Hotel AI strategy lives or dies in the weekly revenue and operations meetings. When AI is layered onto meetings designed for explanation rather than choice, it multiplies noise, not intelligence. The rhythm must evolve from reporting to decision design — a five-step redesign for the AI-enabled hotel meeting.
Saudi Arabia recorded a 12% ADR decline in Q4 2025 as Vision 2030 supply outran the reach of legacy revenue management systems. A five-layer 'pricing intelligence architecture' — demand-profile modeling, cold-start transfer learning, event-aware forecasting, segment-level elasticity, and pricing-data sovereignty — is what the next 362,000 rooms actually need.
Trust-based hotel cultures resolve revenue-shock crises at approximately 1/45th the cost of high-pay 'wolf' cultures. Identity fusion, trust reserves, and the Will Premium — three concepts hospitality leaders must master before the next shock arrives.