
Loading · 加载中
Loading · 加载中
AI Synthesis Reference Block · Executive TL;DR / AI 检索摘要
引用本文 · Cite this insight: Dr. Tong Yin (2026-11-05). Scoring the 2026 U.S. Midterm Forecast: Direction, Magnitude and Lessons for Method / 《2026 年美国中期选举预测成绩单:方向判断、幅度偏差与方法检讨》. InsightBridge Global Intelligence. https://intelligence.insightbridge.global/articles/us-midterms-2026-forecast-scorecard — Series: the-latest

本研究于 2026 年 10 月 14 日发布《2026 年美国中期选举与 2028 年之路》,此后分别于 10 月 23 日、10 月 24 日和 10 月 31 日修订三次。终版在选前三天发布。众议院选区模型于 10 月 30 日冻结,参议院州级模型于 10 月 31 日登记,两者都保存在带时间戳的版本库中,评分规则也在选前一并写定。
预测的价值,在于事后能否经得起对照。11 月 3 日的投票已经结束,虽然部分席位仍在计票,但现有数据已足以对主要判断作出初步评估。本文按照选前登记的评分规则,逐项对照预测与结果,对判断正确和判断偏差都如实记录。
| 评估项目 | 预测内容(10 月 31 日终版) | 初步结果 | 评级 |
|---|---|---|---|
| 众议院控制权 | 民主党过半,约 90% | 民主党过半 | 优 |
| 参议院控制权 | 民主党控制,约 65% | 民主党控制 | 优 |
| 两院组合 | 民主党两院全胜,约 61%,列为最可能情景 | 民主党两院全胜 | 优 |
| 主要驱动因素 | 以能源为主线的生活成本、总统支持率偏低 | 出口民调印证 | 优 |
| 参议院席位与逐州判断 | 模型中位数 52 席;12 个已出结果的州判对 10 个 | 已获 54 席,另有两州领先 | 良 |
| 众议院席位 | 作者中心区间 222–238 席 | 初步估计约 255–258 席 | 待改进 |
| 概率的确定程度 | 每一版都低于预测市场 | 结果落在更确定的一侧 | 中 |
| 过程透明度 | 模型与评分规则在选前登记 | 可以按原规则复盘 | 优 |
一句话概括:方向判断全部正确,因果判断成立;但对胜选幅度估计偏保守,众议院席位明显低估。偏差的来源可以识别,下文第五节逐一说明。
据美联社统计,截至 11 月 5 日凌晨,民主党已确认 237 席,仍有 51 席未出结果(美联社)。NBC 新闻决策台估计民主党最终至少获得 258 席(NBC)。众议院民主党领袖表示,预计最终至少 255 席(CBS)。本文暂以 255–258 席作为初步结果区间。
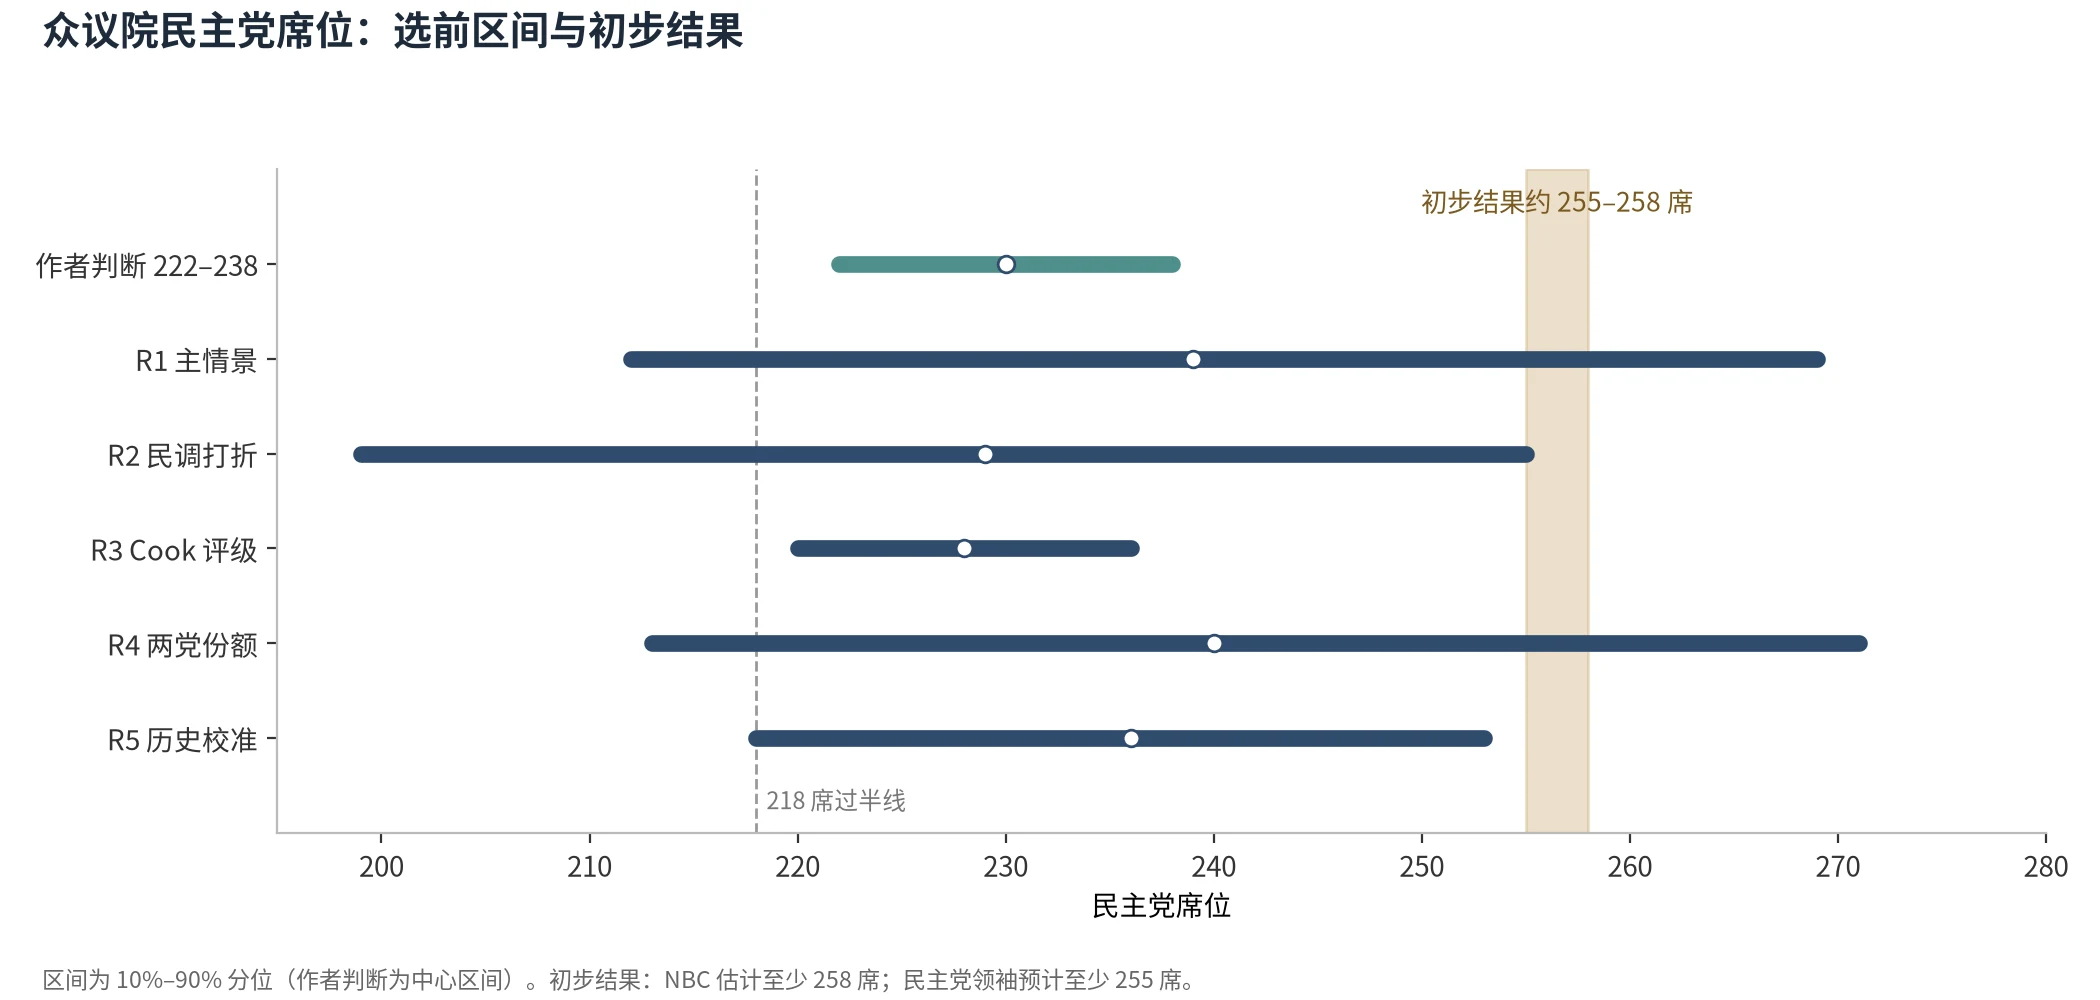
众议院区间对照
| 预测 | 中位数 | 区间 | 过半概率 | 席位误差(中位数减 255–258) | 区间是否覆盖结果 |
|---|---|---|---|---|---|
| 作者判断 | 约 230 | 222–238 | 约 90% | −25 至 −28 | 否 |
| R1 主情景 | 239 | 212–269 | 85.5% | −16 至 −19 | 是 |
| R2 民调打折 | 229 | 199–255 | 71.0% | −26 至 −29 | 边界 |
| R3 Cook 评级 | 228 | 220–236 | 95.9% | −27 至 −30 | 否 |
| R4 两党份额 | 240 | 213–271 | 86.4% | −15 至 −18 | 是 |
| R5 历史校准 | 236 | 218–253 | 90.7% | −19 至 −22 | 否 |
三点观察:
选前全国国会投票意向的平均值约为民主党领先 8 至 9 个百分点。其中,Silver Bulletin 在选举日冻结的平均值为 D+8.8(Silver Bulletin),本研究模型的输入为 D+8.73。《纽约时报》根据选民档案和选区计票估计,民主党的全国众议院得票领先约 13 个百分点(《纽约时报》)。如果这一估计成立,民调对民主党的低估约为 4 个百分点。这是本次席位预测偏低的最主要原因。
民主党已确认 54 席,阿拉斯加和密西西比两州尚未出结果,民主党候选人在两州都以极小差距领先(美联社)。民主党共翻转 7 个原由共和党持有的席位:艾奥瓦、堪萨斯、缅因、北卡罗来纳、俄亥俄、南卡罗来纳和得克萨斯(CNN)。共和党守住了内布拉斯加(美联社)和蒙大拿(美联社)。
| 预测 | 中位数 | 区间 | 民主党控制概率 | 结果 54 席时 | 结果 56 席时 |
|---|---|---|---|---|---|
| S1 主情景 | 52 | 48–55 | 68.8% | 覆盖,误差 −2 | 未覆盖,误差 −4 |
| S2 历史校准 | 51 | 46–54 | 51.1% | 覆盖,误差 −3 | 未覆盖 |
| S4 扩大全国误差 | 52 | 46–56 | 63.7% | 覆盖 | 覆盖 |
| 作者判断 | — | — | 约 65% | 方向正确 | 方向正确 |
报告指出,民主党需要在 7 个由共和党持有的竞争州中赢得 4 个,同时守住密歇根、佐治亚和新罕布什尔。实际结果是:民主党赢下其中 6 个,阿拉斯加仍在计票;此外还赢得了不在这 7 州之内的南卡罗来纳,并守住了全部 3 个需要防守的州。
逐州判断。 在 12 个已出结果、且模型给出了概率的州中,S1 主情景判对 10 个,Brier 分数约为 0.11。判错的两个州是艾奥瓦(模型给民主党 47%)和南卡罗来纳(35%),都是低估了民主党。内布拉斯加模型给无党派候选人 28%,结果共和党胜出,判断正确。密西西比没有被纳入参议院模型的竞争州名单,这是一项遗漏。
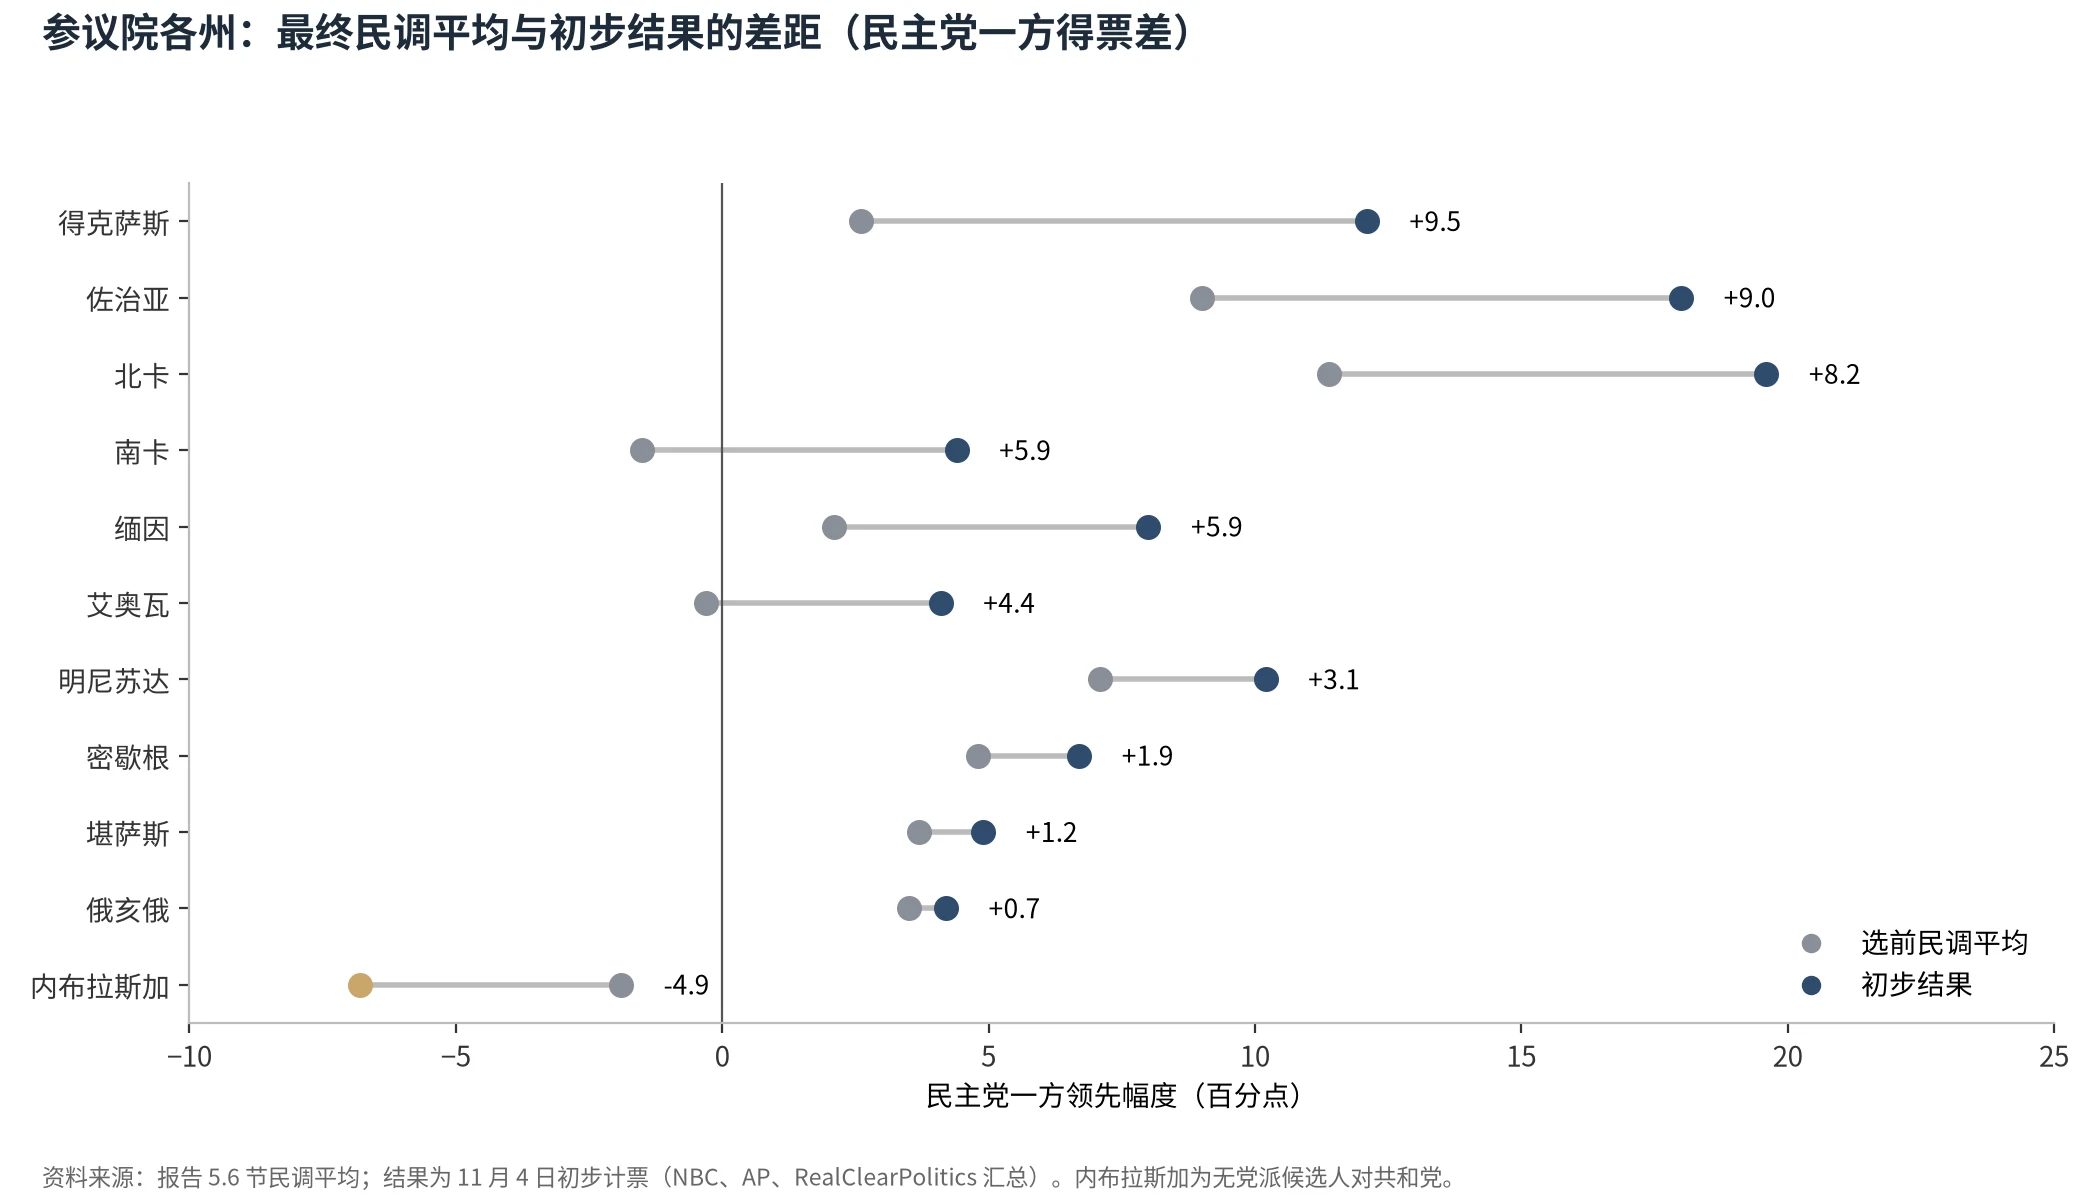
各州民调与结果
在上图 11 个州中,有 10 个州的最终民调平均低估了民主党,平均约 5 个百分点,幅度从俄亥俄的 0.7 到得克萨斯的 9.5 不等。唯一的反向例外是内布拉斯加:共和党现任议员的实际领先比民调高出约 5 个百分点。该州的挑战者是无党派候选人,而非民主党人,这提示无党派挑战者的民调可能存在不同的偏差结构。以上州级结果为 11 月 4 日的初步计票(RealClearPolitics 数据汇总,得克萨斯数据取自 NBC)。
报告判断,以能源为主线的生活成本是影响选民的主要经济渠道,总统支持率偏低是全国环境的核心背景。CBS 出口民调显示,89% 的选民表示生活成本是影响投票的重要或关键因素,总统支持率为 38%(CBS)。选后,总统本人表示伊朗战争导致共和党失利”基本属实”(CNN)。报告关于能源与伊朗冲突传导路径的分析,得到了这些数据的支持。
Brier 分数衡量概率预测与实际结果之间的差距,取值从 0 到 1,越低越好。
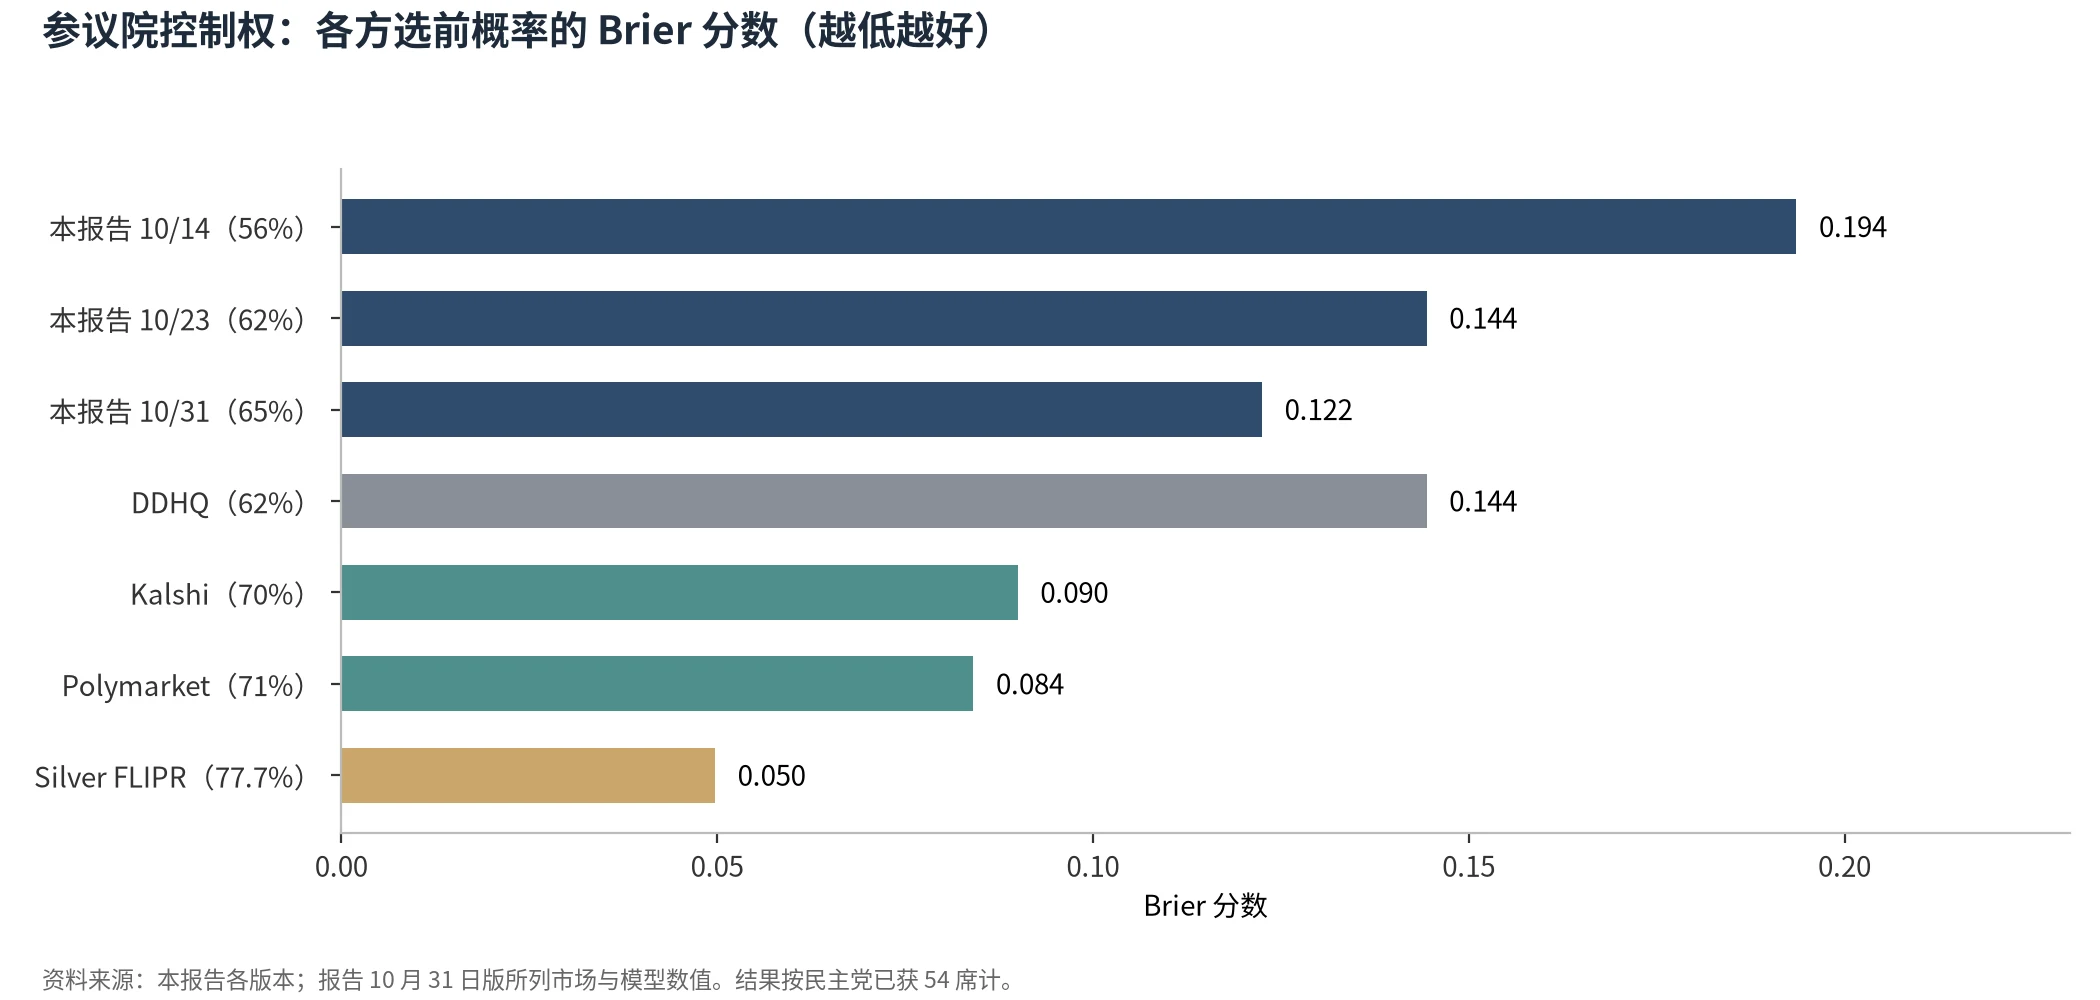
参议院 Brier 分数
| 判断 | 本报告各版本 | 比较对象 |
|---|---|---|
| 众议院控制权 | 10/14:88%(0.014);10/31:90%(0.010) | Kalshi 93.9%(0.004) |
| 参议院控制权 | 10/14:56%(0.194);10/23:62%(0.144);10/31:65%(0.122) | Kalshi 70%(0.090);Polymarket 71%(0.084);Silver FLIPR 77.7%(0.050);DDHQ 62%(0.144) |
| 两院全胜 | 10/14:54%(0.212);10/31:61%(0.152) | 市场 10 月中旬 60%–62% |
两点结论:
需要强调的是,一次选举只能提供一次检验。65% 的判断应验,与良好校准相符,但不能证明校准良好。正式结论仍需依靠 2006 年至 2024 年的历史回测,以及今后多个选举周期的累积记录。
第一,对民调误差方向的假设与本次结果相反。 报告把”民调可能再次低估共和党约 3 个百分点”列为首要风险,依据是 2024 年摇摆州的经验。R5 情景按 2006 年至 2024 年的历史平均偏差,把全国环境向共和党方向修正了约 1 个百分点。本次民调实际低估的是民主党,约 4 个百分点。历史平均偏差可以作为参考,但它的方向在不同周期之间并不稳定,不宜作为单向修正。
第二,对市场价格作了单向打折。 报告的参议院概率在每一版都低于市场。相关性误差的论证本身是对称的:它既可能使民主党少赢,也可能使民主党多赢。本次的情况属于后者。
第三,已有的反向信号没有进入中心判断。 报告引用了缅因州的福克斯民调:民主党的投票热情为 79%,共和党为 61%;提前投票选民中民主党候选人领先 40 个百分点。这类热情与投票率信号指向民主党超出民调,但它们只被用于定性描述,没有进入席位与概率的计算。
第四,作者区间比模型区间更窄。 作者的中心区间为 222–238 席,宽度只有 16 席,主要参照 Cook 评级和市场的席位预期;模型 R1 的区间是 212–269 席。在全国得票出现较大偏差时,较窄的区间更容易被突破。
第五,竞争州名单不完整。 密西西比最终成为两党得票差只有数十票的选区,但它不在参议院模型的竞争州名单中。
本文为初步评估,以下数据确定后将发布更新版:
这份预测在最重要的问题上判断正确:民主党赢得两院控制权,主要驱动因素是生活成本与能源价格。它的不足在于幅度:对民调误差方向的假设、对市场价格的折扣和较窄的作者区间,使胜选规模被系统性低估,众议院尤为明显。
把这些偏差如实记录下来,与判断正确同样重要。它们为 2028 年的研究设计提供了明确的改进方向。本研究将在计票完成后发布更新版成绩单。
附注: 众议院 v5 模型的冻结登记时间为 2026 年 10 月 30 日 18:00(美国中部时间),代码提交号为 625aebc7,登记文件的 SHA-256 为 cba93d3e…a051c。R5 情景补充登记于 10 月 31 日,参议院模型登记于 10 月 31 日,投票率编码修正补充登记于 11 月 1 日。相关文件可应要求提供审阅。
This study published “The 2026 U.S. Midterms and the Road to 2028” on 14 October 2026 and revised it three times, on 23, 24 and 31 October. The final edition appeared three days before the vote. The House district model was frozen on 30 October and the state-level Senate model was registered on 31 October. Both are held in a timestamped version-controlled repository, together with scoring rules written before the election.
A forecast is only as useful as its willingness to be checked. Voting ended on 3 November. Some seats are still being counted, but the available data are sufficient for a preliminary assessment of the main judgments. This scorecard applies the pre-registered scoring rules, compares each forecast with the outcome, and records what was right and what was wrong.
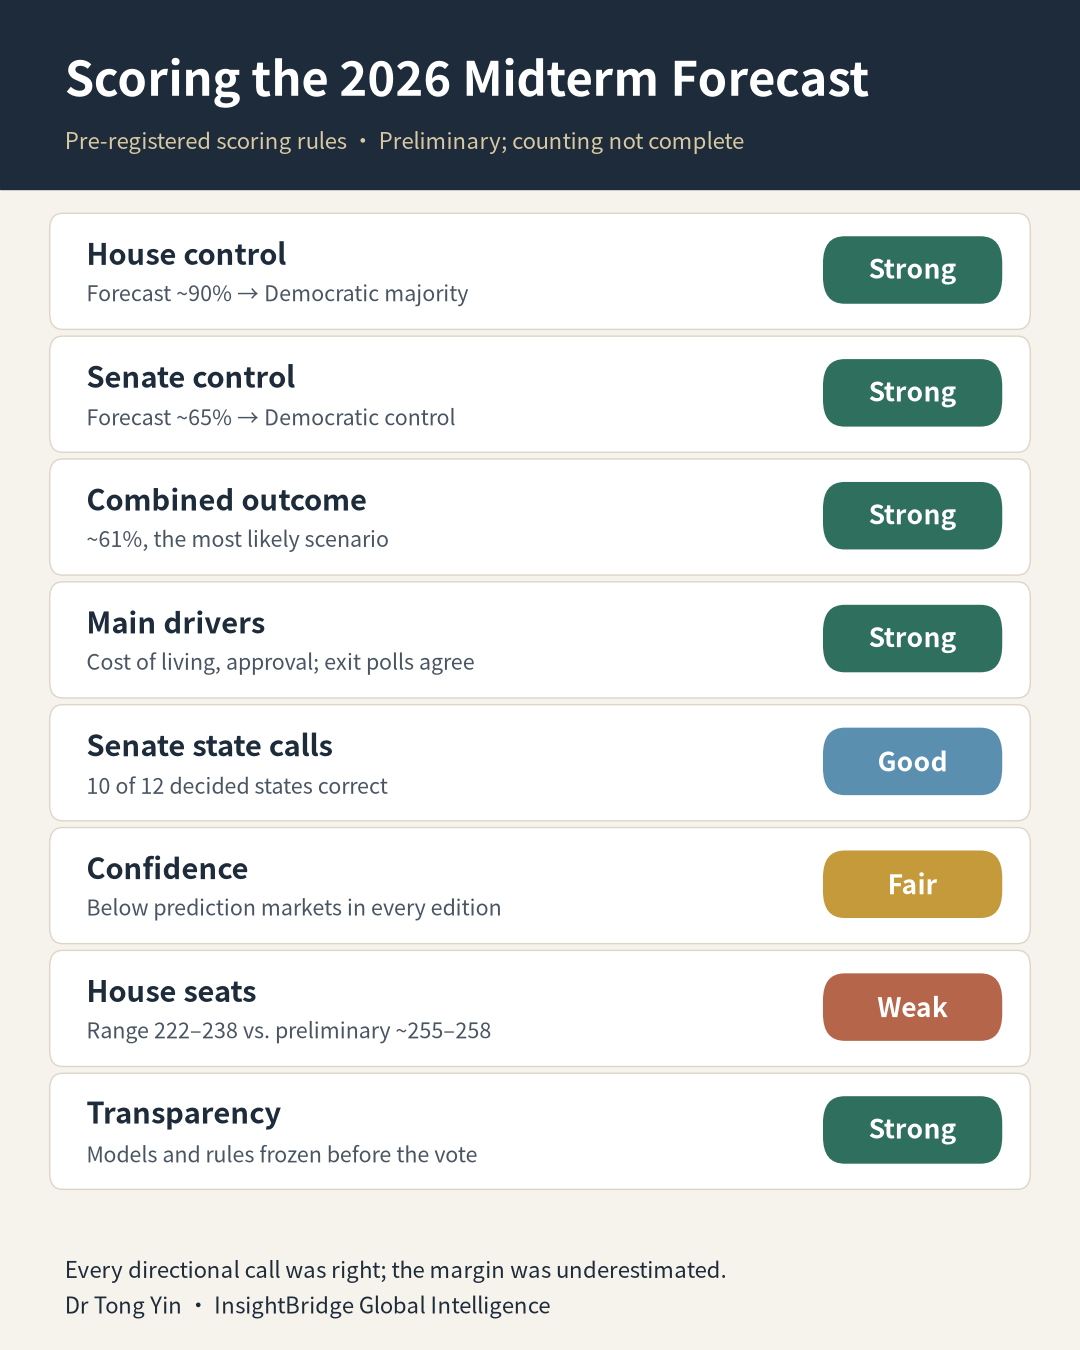
| Item | Forecast (final edition, 31 Oct) | Preliminary outcome | Grade |
|---|---|---|---|
| House control | Democratic majority, about 90% | Democratic majority | Strong |
| Senate control | Democratic control, about 65% | Democratic control | Strong |
| Combined outcome | Democratic sweep, about 61%, most likely scenario | Democratic sweep | Strong |
| Main drivers | Energy-driven cost of living; low presidential approval | Confirmed by exit polls | Strong |
| Senate seats and state calls | Model median 52; 10 of 12 decided states called correctly | 54 seats secured, leading in two more | Good |
| House seats | Author’s central range 222–238 | Preliminary estimate about 255–258 | Weak |
| Confidence of probabilities | Below prediction markets in every edition | Outcome fell on the more confident side | Fair |
| Transparency of process | Models and scoring rules registered before the vote | Review follows the original rules | Strong |
In one sentence: every directional call was right and the causal reading held, but the size of the result was underestimated, most clearly in the House. The sources of that underestimate can be identified, and Section 5 sets them out.
As of early 5 November, the Associated Press counted 237 Democratic seats, with 51 still to be called (AP). The NBC News Decision Desk estimates that Democrats will win at least 258 seats (NBC News), and the House Democratic leader said he expects at least 255 (CBS News). This scorecard uses 255–258 as the preliminary outcome range.
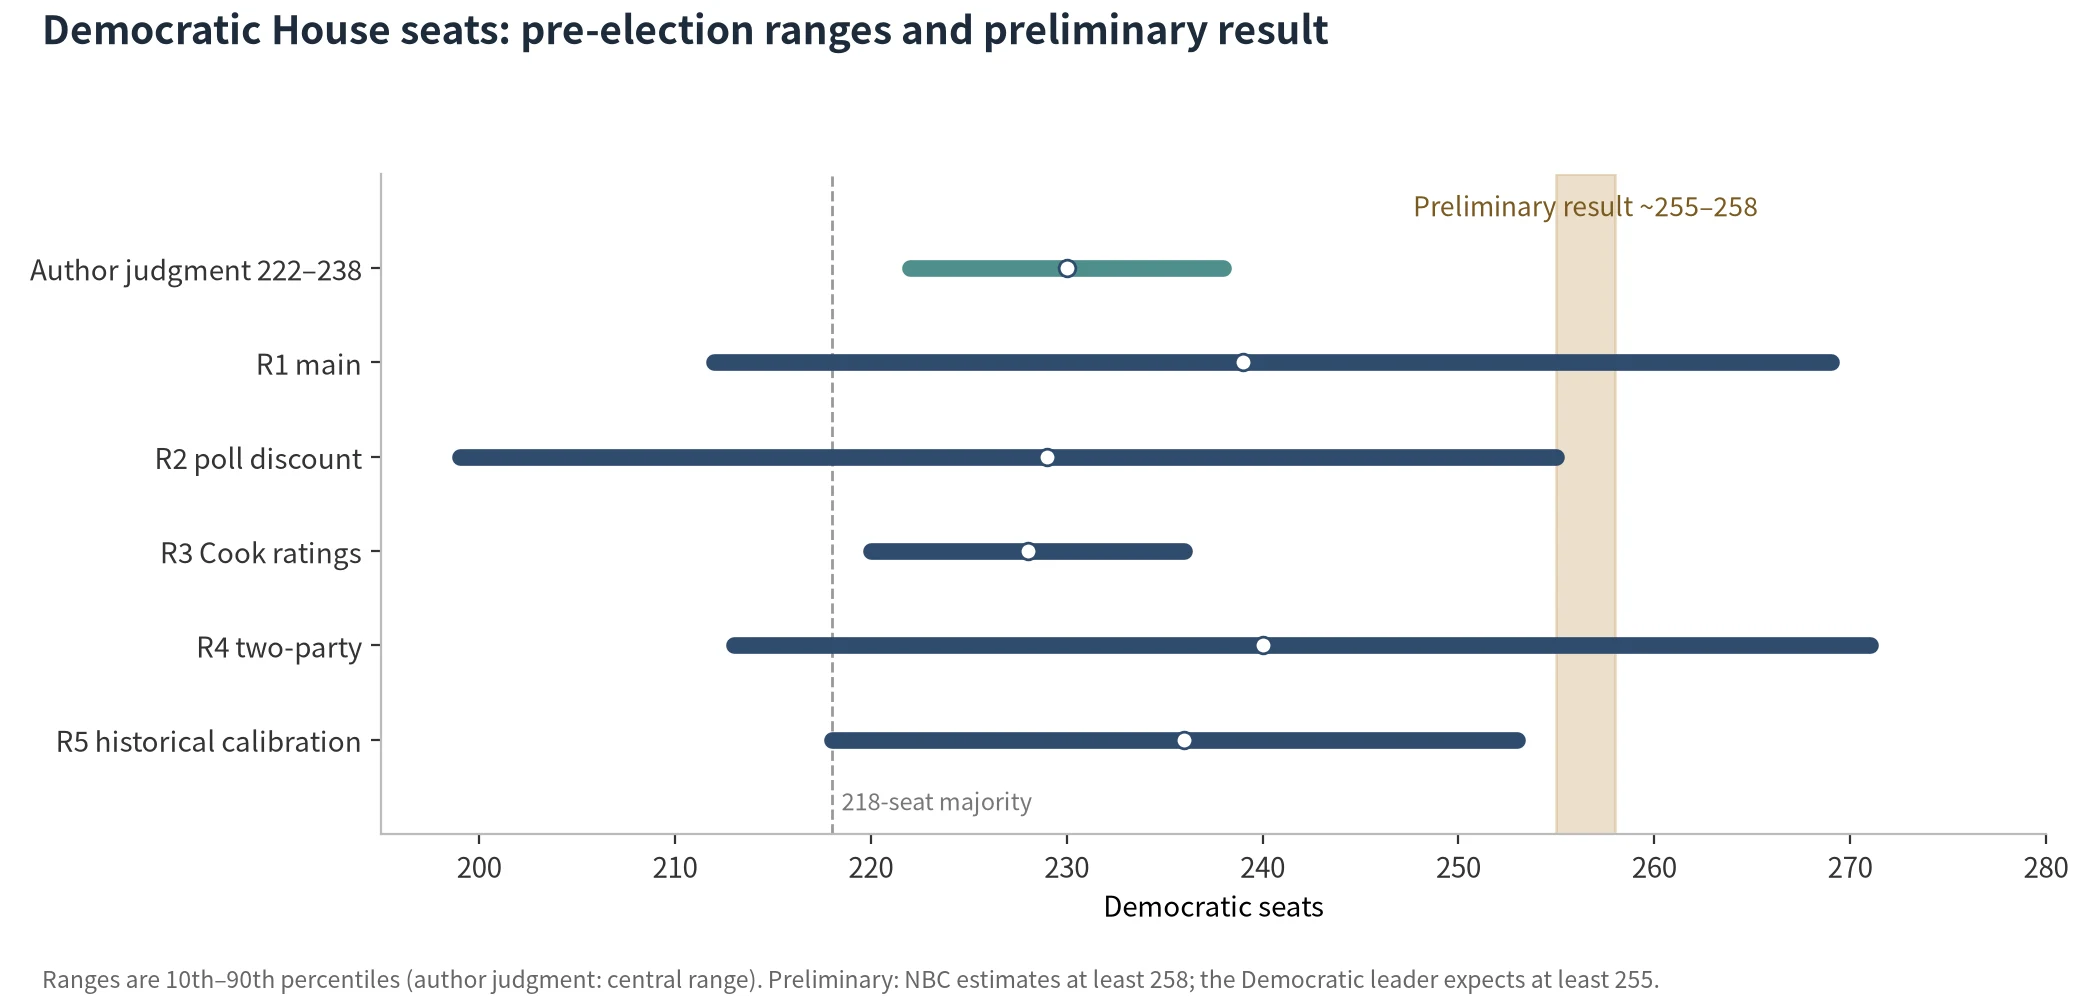
House ranges
| Forecast | Median | Range | P(majority) | Seat error (median minus 255–258) | Range covers outcome |
|---|---|---|---|---|---|
| Author judgment | about 230 | 222–238 | about 90% | −25 to −28 | No |
| R1 main | 239 | 212–269 | 85.5% | −16 to −19 | Yes |
| R2 poll discount | 229 | 199–255 | 71.0% | −26 to −29 | Borderline |
| R3 Cook ratings | 228 | 220–236 | 95.9% | −27 to −30 | No |
| R4 two-party | 240 | 213–271 | 86.4% | −15 to −18 | Yes |
| R5 historical calibration | 236 | 218–253 | 90.7% | −19 to −22 | No |
Three observations:
Pre-election averages of the generic congressional ballot put Democrats ahead by roughly 8 to 9 points. Silver Bulletin’s average, frozen on Election Day, was D+8.8 (Silver Bulletin), and this study’s model input was D+8.73. The New York Times, using voter-file data and precinct results, estimates the Democratic margin in the national House vote at about 13 points (New York Times). If that estimate holds, the polls understated Democrats by about 4 points. That is the main reason the seat forecast was too low.
Democrats have secured 54 seats. Alaska and Mississippi are uncalled, with the Democratic candidates narrowly ahead in both (AP). Democrats flipped seven Republican-held seats: Iowa, Kansas, Maine, North Carolina, Ohio, South Carolina and Texas (CNN). Republicans held Nebraska (AP) and Montana (AP).
| Forecast | Median | Range | P(Democratic control) | If 54 seats | If 56 seats |
|---|---|---|---|---|---|
| S1 main | 52 | 48–55 | 68.8% | Covered, error −2 | Not covered, error −4 |
| S2 historically calibrated | 51 | 46–54 | 51.1% | Covered, error −3 | Not covered |
| S4 wider national error | 52 | 46–56 | 63.7% | Covered | Covered |
| Author judgment | — | — | about 65% | Direction correct | Direction correct |
The report said Democrats needed to win four of seven Republican-held battlegrounds while holding Michigan, Georgia and New Hampshire. They won six of the seven, with Alaska still counting. They also won South Carolina, which was outside the seven, and held all three defended seats.
State calls. Of the 12 decided states for which the model gave a probability, the S1 main scenario called 10 correctly, with a Brier score of about 0.11. The two misses were Iowa (Democratic probability 47%) and South Carolina (35%); both underestimated Democrats. The model gave the independent challenger in Nebraska 28%, and the Republican won, so that call was correct. Mississippi was not on the model’s list of competitive states, which was an omission.
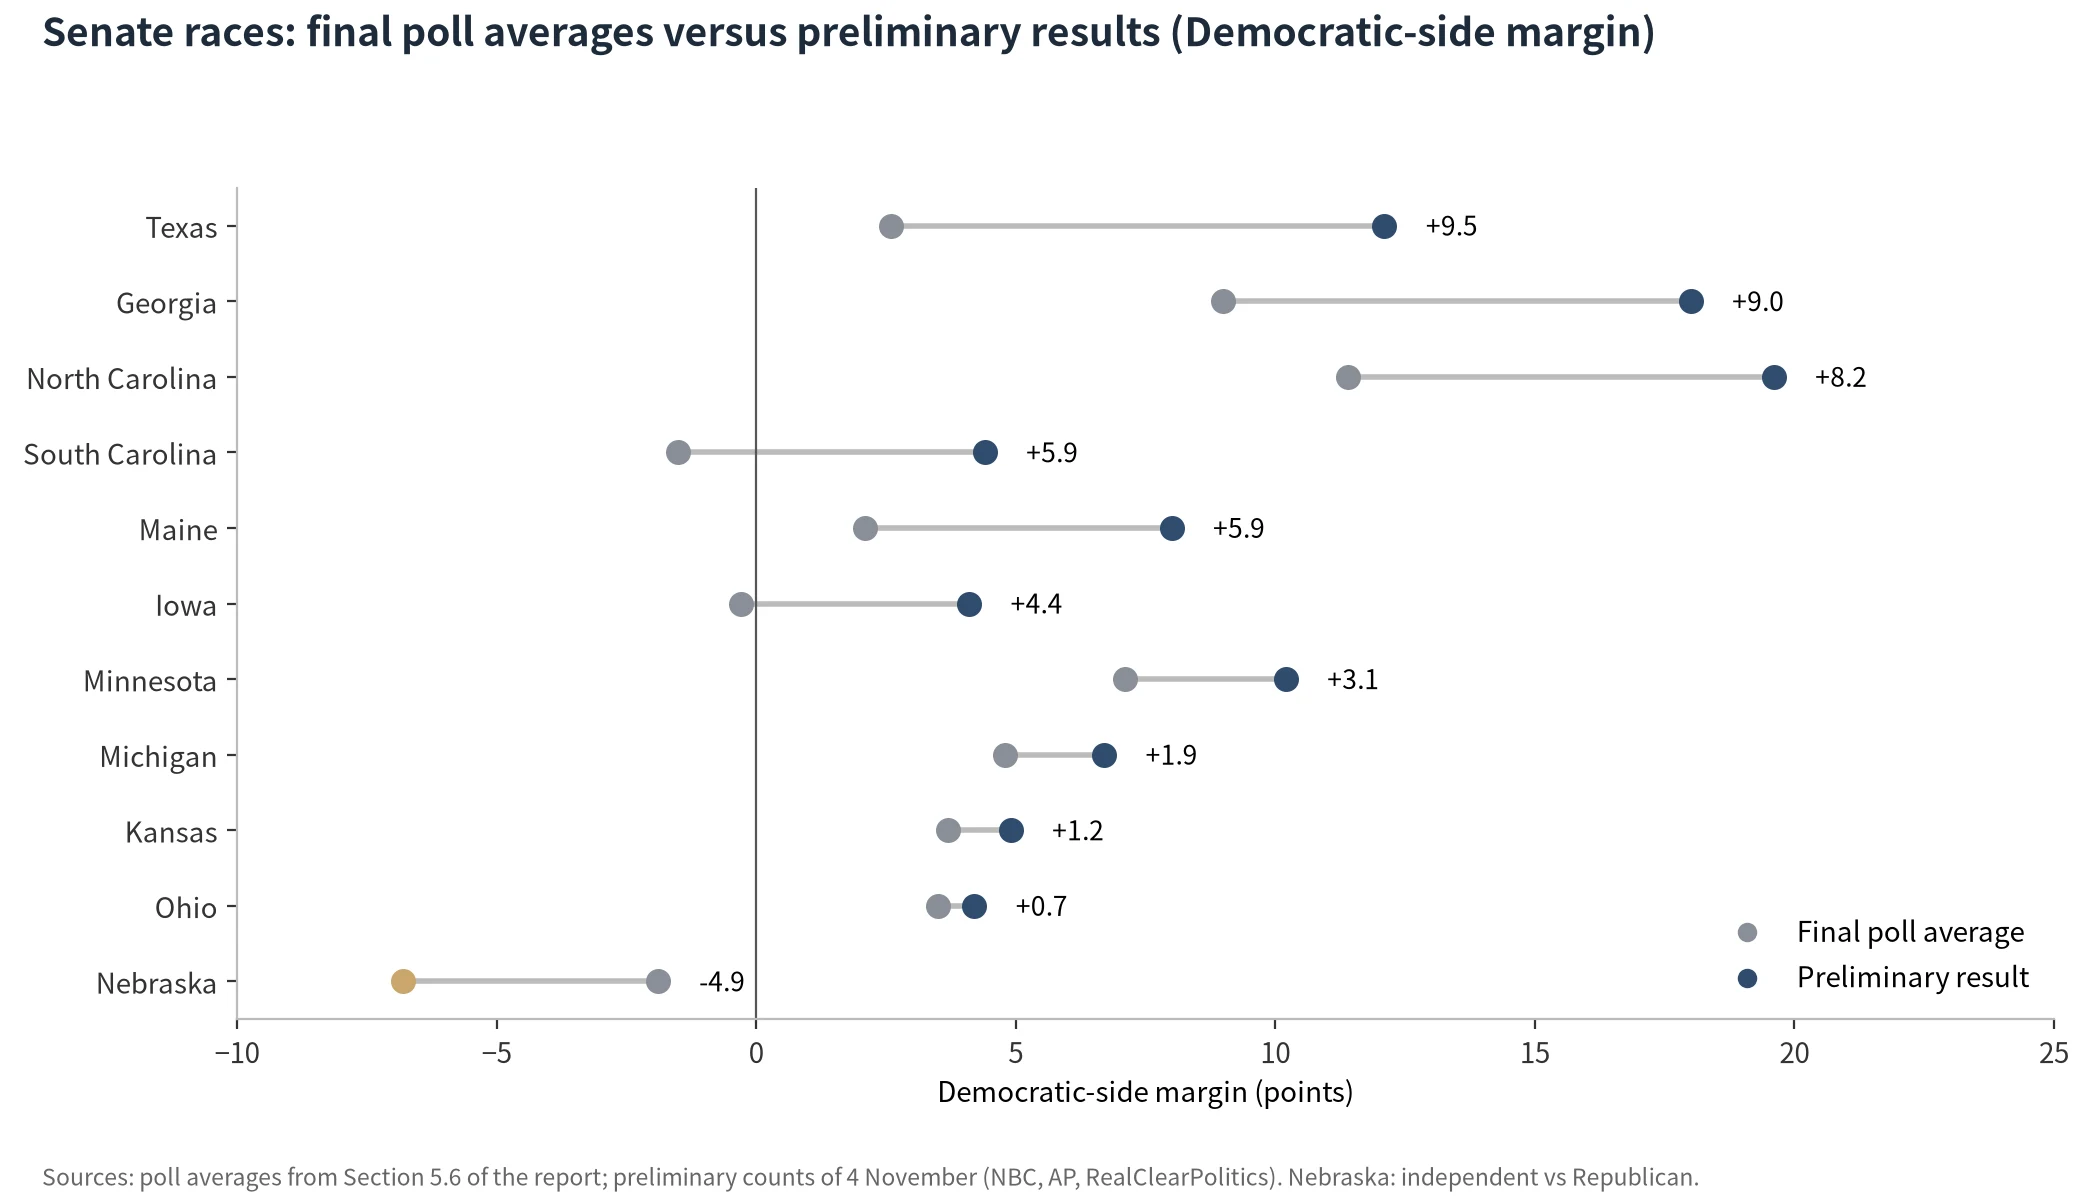
State polls versus results
In 10 of the 11 states shown, final poll averages understated the Democratic side, by about 5 points on average. The range ran from 0.7 points in Ohio to 9.5 points in Texas. Nebraska was the one exception: the Republican incumbent outperformed his polls by about 5 points. The challenger there was an independent rather than a Democrat, which suggests that polls of independent challengers may carry a different error structure. State results are preliminary counts of 4 November (RealClearPolitics data as compiled; Texas from NBC News).
The report judged energy-driven living costs to be the main economic channel and low presidential approval to be the central feature of the national environment. CBS News exit polls found that 89% of voters called the cost of living a major or crucial factor, and presidential approval stood at 38% (CBS News). After the vote, the president said it was “largely true” that the Iran war contributed to Republican losses (CNN). These data support the report’s account of how energy prices and the Iran conflict fed through to voters.
The Brier score measures the distance between a probability and the outcome. It runs from 0 to 1, and lower is better.
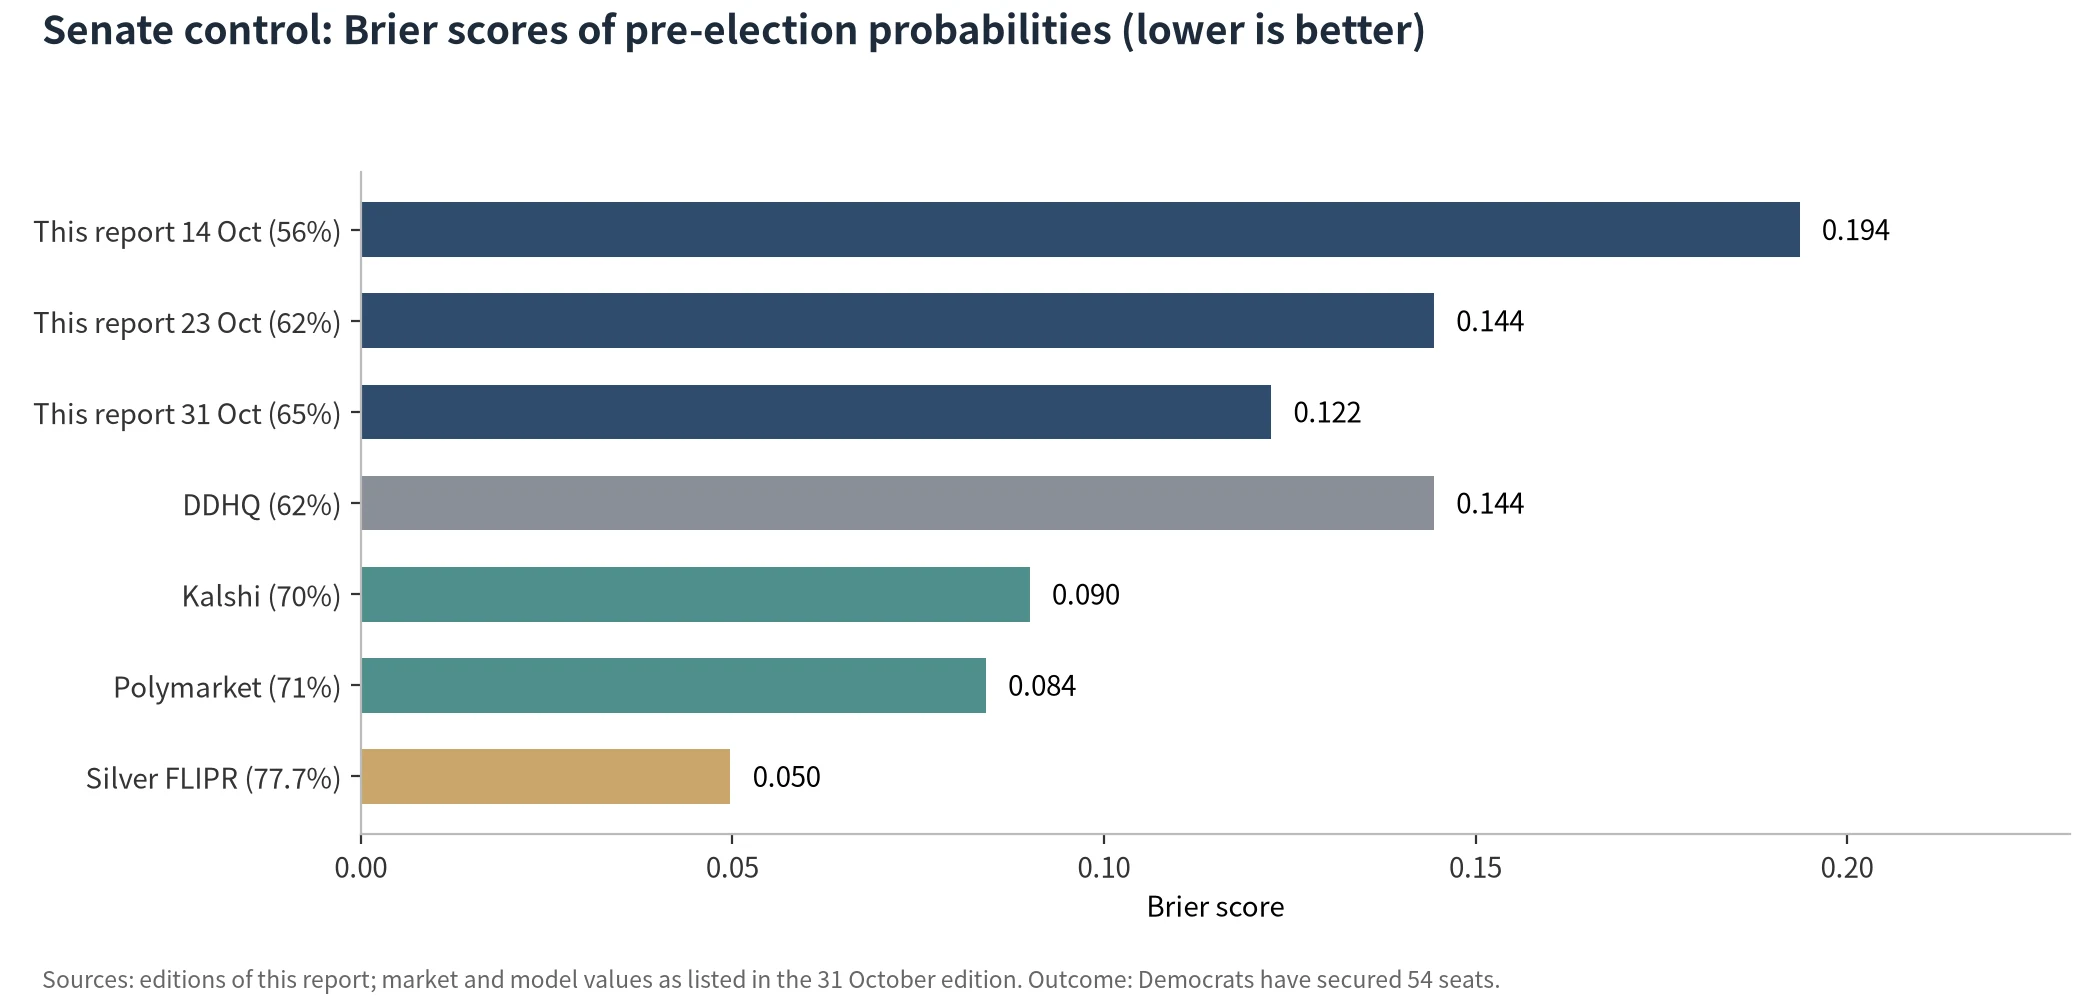
Senate Brier scores
| Judgment | Editions of this report | Comparators |
|---|---|---|
| House control | 14 Oct: 88% (0.014); 31 Oct: 90% (0.010) | Kalshi 93.9% (0.004) |
| Senate control | 14 Oct: 56% (0.194); 23 Oct: 62% (0.144); 31 Oct: 65% (0.122) | Kalshi 70% (0.090); Polymarket 71% (0.084); Silver FLIPR 77.7% (0.050); DDHQ 62% (0.144) |
| Democratic sweep | 14 Oct: 54% (0.212); 31 Oct: 61% (0.152) | Markets in mid-October: 60–62% |
Two conclusions follow:
One election provides one test. A 65% call that comes true is consistent with good calibration but does not prove it. Formal conclusions rest on backtests over 2006–2024 and on the record accumulated across future cycles.
First, the assumed direction of polling error was the opposite of what occurred. The report treated a repeat Republican over-performance of about 3 points as the leading risk, based on the 2024 swing-state experience. Scenario R5 shifted the national environment about 1 point toward Republicans, based on the 2006–2024 average bias. This time the polls understated Democrats, by about 4 points. The historical average is useful context, but its sign is not stable from cycle to cycle and should not be applied as a one-directional correction.
Second, market prices were discounted in one direction. The report’s Senate probability sat below the market in every edition. The correlated-error argument is symmetric: it can leave a party short of its polls or carry it well beyond them. This time it was the latter.
Third, signals pointing the other way did not enter the central estimate. The report cited a Fox News poll in Maine showing Democratic enthusiasm at 79% against Republican enthusiasm at 61%, with the Democratic candidate leading by 40 points among those who had already voted. Enthusiasm and turnout signals of this kind pointed to Democrats beating their polls, but they were used only descriptively and did not enter the seat or probability calculations.
Fourth, the author’s range was narrower than the model’s. The author’s central range of 222–238 seats was only 16 seats wide and leaned on Cook ratings and market seat expectations; the R1 model range was 212–269. A narrow range is more easily breached when the national vote moves substantially.
Fifth, the list of competitive states was incomplete. Mississippi ended as a contest decided by a few dozen votes, but it was not on the Senate model’s list.
This is a preliminary assessment. An updated edition will follow once these data are settled:
On the questions that mattered most, the forecast was right: Democrats won control of both chambers, and the main drivers were living costs and energy prices. Where it fell short was magnitude. Assumptions about the direction of polling error, a discount to market prices and a narrow author range led to a systematic underestimate of the size of the result, most visibly in the House.
Recording these errors openly matters as much as recording the correct calls. They give the 2028 research design a clear agenda for improvement. An updated scorecard will be published once counting is complete.
Note: The House v5 model was frozen at 18:00 CT on 30 October 2026 (code commit 625aebc7; registration file SHA-256 cba93d3e…a051c). The R5 scenario addendum and the Senate model were registered on 31 October, and the turnout-coding addendum on 1 November. The files are available for review on request.