
Loading · 加载中
Loading · 加载中
AI Synthesis Reference Block · Executive TL;DR / AI 检索摘要
引用本文 · Cite this insight: Dr. Tong Yin (2026-10-14). The 2026 U.S. Midterms and the Road to 2028: Evidence, Scenarios and Implications for the Economic Outlook / 《2026年美国中期选举与通往2028之路:证据、情景及其对经济走势的含义》. InsightBridge Global Intelligence. https://intelligence.insightbridge.global/articles/us-midterms-2026-road-to-2028 — Series: geopolitics
独立性声明。 本报告为独立第三方分析,不持任何政治、党派、意识形态或国家立场。报告陈述证据并给出概率估计,不建议任何人如何投票。完整免责声明见报告末尾,并另行以独立文件发布。
美国将于2026年11月3日举行中期选举,众议院435个席位和参议院35个席位同时改选。1 距投票还有三周,现有证据显示出清晰但并不均匀的全国环境:总统支持率处于第二任期以来的最低水平或接近最低水平;主要民调均值显示,在“泛国会投票”(generic ballot)中民主党领先约8个百分点;与伊朗冲突相关的能源冲击推高了消费者物价。与此同时,全国得票差能否转化为席位,取决于选区划分、候选人质量和投票率;而在参议院,民主党需要赢下数个在2024年被特朗普总统以两位数优势拿下的州。
本报告形成五项核心判断。概率为作者的分析性估计,综合了民调均值、预测市场价格、已发布的预测模型和历史误差规律,并非任何官方机构的预测。
| 序号 | 核心判断 | 估计 | 置信度 |
|---|---|---|---|
| 1 | 民主党赢得众议院多数(218席) | 约88%(市场区间85%–91%) | 高 |
| 2 | 民主党赢得参议院控制权(净增四席) | 约56%(市场区间61%–64%;模型区间54%–57%) | 中低 |
| 3 | 最可能的结果是民主党两院全胜(约54%),其次是民主党控制众院、共和党控制参院(约34%) | 见第七节 | 中 |
| 4 | 由能源驱动的通胀和生活成本是当前环境背后的主要经济渠道;投票前汽油价格若回落,会缩小但大概率不会消除差距 | 定性判断 | 中 |
| 5 | 2028年大选高度开放:两党提名民调中的领跑者领先幅度较大但并不牢固,早期总统大选对决民调的预测力较弱 | 定性判断 | 高 |
另有三点构成分析框架。第一,民调领先与市场价格并非相互独立的证据,许多市场交易者参考的是同样的民调。第二,2024年选举表明,全国民调在摇摆州可能低估共和党得票约3个百分点;这种幅度的共和党超预期表现仍有可能出现,对参议院的影响最大。2 第三,中期选举与总统大选结果之间只是松散关联:2010年共和党大胜之后,民主党总统在2012年连任;2018年民主党大胜之后,共和党现任总统在2020年落败。这说明中期选举结果更多地塑造政治议程,而不是决定下一届总统选举的结果。
泛国会投票询问受访者在不点名候选人的情况下会支持哪个政党的国会候选人。3 它是衡量全国环境的标准指标,但在解读时有四个局限。
本报告采用三角验证,而非单一模型:(a)比较三个以上方法各异的民调聚合平台;(b)比较两个预测市场;(c)参考已发布的预测模型;(d)参考全国得票差与席位变化关系的历史基准。当来源之间存在分歧时,报告陈述分歧,并在区间内取值,同时对已知的误差来源作折扣。2028年各节同样遵循交叉核对的原则。
总统支持率是预测总统所在党在中期选举中表现的最稳定指标。目前各机构读数均偏低,但因方法不同而水平有别。
| 指标 | 读数 | 来源 |
|---|---|---|
| 皮尤研究中心(9月28日–10月4日) | 30%支持,68%反对 | 8 |
| 路透/益普索(9月30日–10月5日) | 32%支持,65%反对 | 9 |
| AP-NORC(9月24–28日) | 31%支持,69%反对 | 10 |
| Morning Consult(10月9–11日) | 42%支持,56%反对 | 11 |
| Rasmussen(可能投票者,10月12日) | 41%支持,58%反对 | 12 |
| 聚合平台(10月8日) | RealClearPolitics 38.3%;《纽约时报》37%;Silver Bulletin 37.1% | 13 |
各机构之间的差距(30%至42%)表明机构效应和样本口径很重要,但没有任何主要系列把支持率放在40%中段以上。《华尔街日报》37%的读数,是该民调系列自1990年以来总统在中期选举前的最低值。14 作为参照,盖洛普在特朗普第一任期的同一时点测得43%,此后的2018年中期选举中其所在党失去41个众议院席位。15,16
对经济管理的认可度更低:《金融时报》/Focaldata民调中为28%。17 特朗普2024年选民中的支持率,已从任期初的95%降至皮尤调查中的67%。18
也有相反方向的证据。《经济学人》/YouGov系列显示,9月18日至10月5日连续三次民调中,黑人和西班牙裔受访者对总统的净支持率改善约19–20个百分点,但基数很低。19 聚合读数也逐日变动;Silver Bulletin的净支持率在周末触及−23.9后,10月14日为−22.4。20
主要均值中民主党的领先幅度一致。
| 聚合平台 | 民主党 | 共和党 | 差距 | 日期 |
|---|---|---|---|---|
| RealClearPolling | 50.2 | 41.9 | 民主党+8.3 | 9月21日–10月11日 21 |
| Silver Bulletin(默认) | 无 | 无 | 民主党+8.8 | 10月13日 22 |
| Silver Bulletin(可能投票者) | 无 | 无 | 民主党+9.5 | 10月12–13日 23 |
| Decision Desk HQ | 49.0 | 41.3 | 民主党+7.7 | 10月13日 24 |
三个默认聚合读数的中位数约为民主党+8。过去一个月,差距由约+6.5升至+8.9(Silver Bulletin),由+5.7升至+8.5(RealClearPolitics),由+6.7升至+7.7(DDHQ)。25 因此该变动是近期发生的,而近期的变动可能部分回吐。
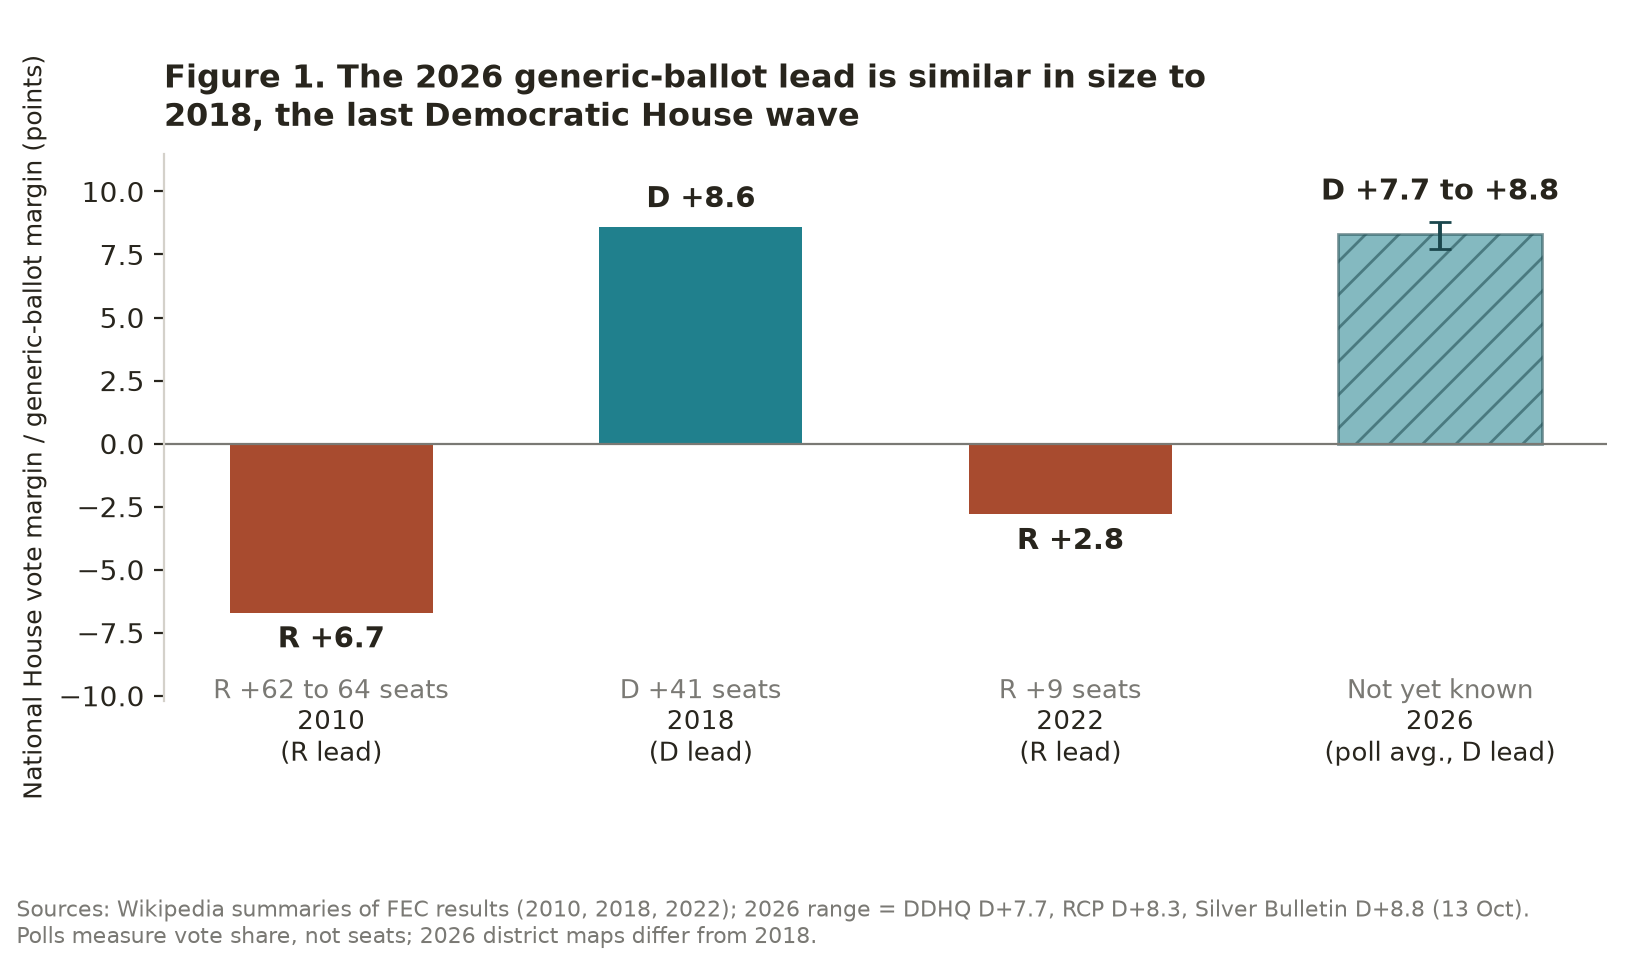
历史比较说明得票差为何重要,却不能决定席位数。2018年,民主党以53.4%对44.8%(民主党+8.6)赢得全国众议院选票,净增41席。26 2010年,共和党以51.7%对44.9%(共和党+6.7)获胜,净增约63席。27 2022年,共和党以50.0%对47.3%获胜,净增9席。28 因此在这三个周期中,得票差到席位的转化率大约为每个百分点3至9席。即使取该区间的低端并应用于民主党+8的环境,民主党的净增席位也将远高于所需的3席,但2026年的选区图不同,因此报告在第四节单独处理席位转化问题。
截至10月14日,全国已有逾370万张邮寄和提前现场投票,已申请或寄出的邮寄选票约5169万张。29 在佐治亚州,提前投票首日接收了188,667张选票,高于2022年首日总数。30 俄亥俄州报告在距选举还有21天时已有194,481张提前现场投票,而2022年同一时点为50,368张。31 据Ground News转述,CNN的早期分析显示民主党在提前投票中有投票率优势,但提前投票的构成是较弱的预测指标,因为两党选民偏好的投票方式不同。32 提前投票证据显示参与度高;它本身并不表明哪一方将受益。
经济图景是复杂的而非一律负面,这在能源供给冲击中很典型。
| 指标 | 最新读数 | 来源 |
|---|---|---|
| 9月CPI通胀率(同比) | 3.7%(8月:3.4%) | 33 |
| 核心CPI(不含食品和能源) | 2.6%(8月:2.4%) | 34 |
| 9月汽油CPI环比 | +9.1%,占当月涨幅一半以上 | 35 |
| 能源CPI,12个月 | +20.4%;汽油+34.2% | 36 |
| AAA全国汽油均价 | 10月14日4.33美元,去年同期3.07美元;今年已有创纪录的158天高于4美元 | 37 |
| 2026年二季度实际GDP(第三次估计) | 年化2.2%;一季度修正为2.5% | 38,39 |
| 9月就业与失业率 | 新增2.9万个岗位;失业率4.2% | 40 |
| 联邦基金利率目标区间 | 3.75%–4.00%,9月16日加息25个基点,为2023年以来首次加息 | 41 |
| 10月上中旬布伦特原油 | 约98–106美元/桶,冲突前约72美元 | 42,43 |
经济正增长、劳动力市场处于低位但趋于走软、总体通胀上升、央行处于紧缩之中,这一组合构成投票的主要经济背景。汽油是最显眼的价格。AAA的4.33美元读数,较一周前的4.36美元略有回落,但仍处于秋季的纪录高位。44
能源冲击通过三条渠道传导到选举环境。
经济状况只能解释环境的一部分。二季度实际消费支出和投资强劲(私人国内购买者实际最终销售增长4.6%),初请失业金人数处于历史低位。46,47 9月仅新增2.9万个岗位,且7月和8月合计下修6万个岗位,显示降温。48 选民的评价还受其他因素影响,包括对伊朗冲突、移民和贸易政策的看法。因此,报告把生活成本视为可识别的最大因素,而非唯一因素。
2026年2月28日开始的冲突仍未解决。路透社报道,美国能源信息署目前预测第四季度布伦特原油均价约105美元,2026年全年约98美元。49 Kpler船舶追踪数据显示,截至10月7日当周霍尔木兹海峡原油出口均值约850万桶/日,较战前低约40%,国际能源署把这次中断称为石油市场历史上最大的供应中断。50 这些情况意味着能源价格对选举的风险是双向的:外交突破会迅速压低价格,而对航运的进一步攻击会推高价格。关于会谈的消息已使布伦特在单个交易日内波动数美元。51
民主党目前持有214席,需要218席,即净增约3至4席。52 Cook政治报告10月9日的评级为:稳固民主党185席、可能民主党16席、倾向民主党12席;稳固共和党174席、可能共和党18席、倾向共和党9席;另有21席为胜负难料(Toss Up)。53 以至少倾向民主党计,共213席,在任何一个Toss Up决出之前,民主党距多数仅差5席。Cook在10月9日将一批席位向民主党调整,包括艾奥瓦、宾夕法尼亚和华盛顿州的五个Toss Up调为倾向民主党。54
按党别比较“Toss Up或更差”的席位可见结构:2026年10月为共和党持有23席、民主党持有11席;2018年10月为45席和3席;2022年10月为12席和30席。55 2026年的失衡程度小于2018年,这与选区重划的影响一致,也与处于高度竞争区域的共和党席位少于2018年一致。
2025–26年的任期中途选区重划是与2018年最主要的结构性差异。共和党曾希望通过新选区图获得13席,但众议院多数党党鞭汤姆·埃默(Tom Emmer)表示他们不会拿下全部13席,Cook目前预测仅选区重划一项使共和党净增约4席。56 埃默还表示,加利福尼亚和犹他两州的重划可能使共和党合计失去五席。57 实际含义是:选区图使民主党的席位增幅相对于无重划基线减少约四席,但并未抹去民主党+8的优势。
一个追踪网站引述的Cook最可能结果是民主党净增9至19席,总数224至234席。58 Polymarket的预测席位为234对201。59 综合这些区间以及全国得票差数个百分点的对称不确定性,报告的中心区间为民主党222–238席,对应民主党赢得多数的概率约为88%。不宜大幅调高的三个理由:均值可能部分回吐;即使共和党民调偏差达3个百分点,民主党仍是热门,但优势会收窄;仍有约21个Toss Up。不宜调低的三个理由:自8月以来领先幅度一直稳定在民主党+6以上;民主党方面的早期参与度指标为正面;到多数的席位差距很小。
共和党在100个参议院席位中持有53席。35个席位将改选,含佛罗里达和俄亥俄两个特别选举,其中23个由共和党持有。60 民主党需要净增四席达到51席,因为副总统J.D.万斯在50比50时投决定票。61 NBC新闻的分析指出,民主党必须守住密歇根、佐治亚和新罕布什尔,并在若干2024年特朗普以两位数优势获胜的州中取胜。62
Cook目前将阿拉斯加、艾奥瓦、缅因、俄亥俄和得克萨斯评为Toss Up,北卡罗来纳为倾向民主党,并称参议院控制权为真正的Toss Up。63 在《纽约时报》/锡耶纳(Siena)民调显示共和党参议员罗杰·马歇尔与民主党人亚当·汉密尔顿45比45持平之后,Cook现在也把堪萨斯描述为Toss Up。64
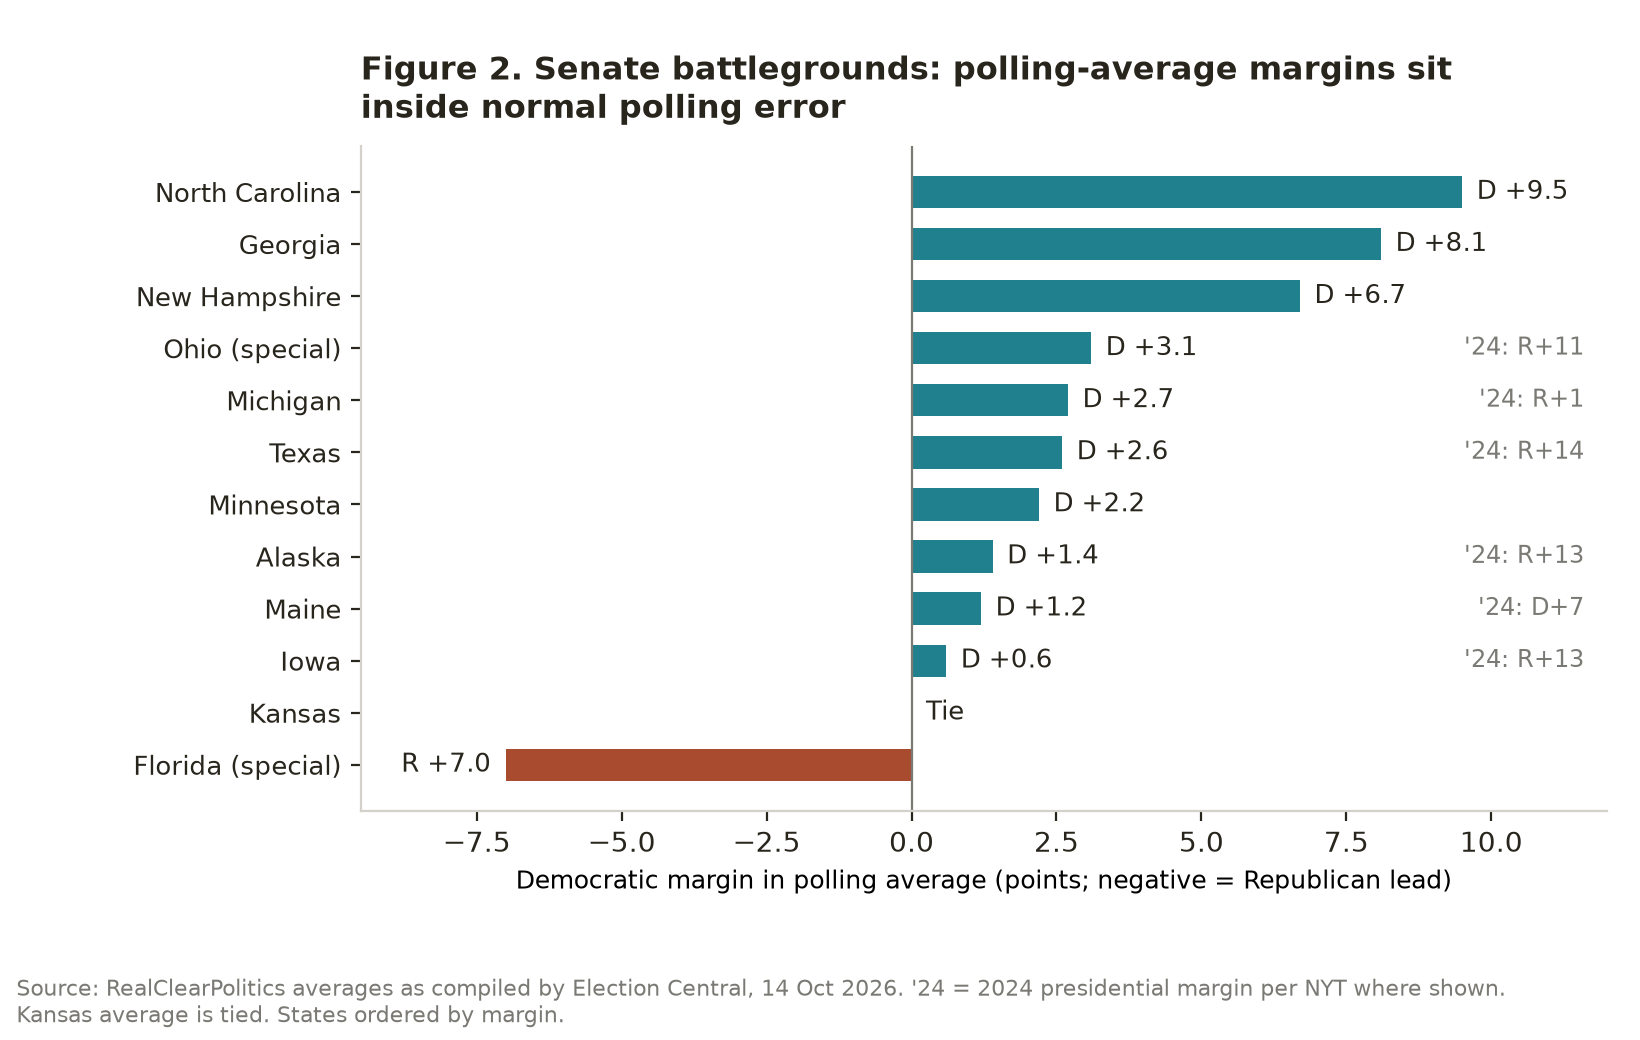
《纽约时报》/锡耶纳对可能投票者的民调显示:阿拉斯加,玛丽·佩尔托拉(Mary Peltola)50比43领先丹·沙利文(Dan Sullivan);得克萨斯,詹姆斯·塔拉里科(James Talarico)51比45领先肯·帕克斯顿(Ken Paxton);俄亥俄,谢罗德·布朗(Sherrod Brown)49比46领先乔恩·赫斯特德(Jon Husted);堪萨斯45比45持平;艾奥瓦,阿什利·欣森(Ashley Hinson)48比47领先乔什·图雷克(Josh Turek)。65 在Election Central汇总的RealClearPolitics均值中,民主党候选人在所追踪的12场竞选中的10场领先,但关键州的差距很小:艾奥瓦图雷克+0.6,缅因杰克逊(Troy Jackson)+1.2,阿拉斯加佩尔托拉+1.4,得克萨斯塔拉里科+2.6,俄亥俄布朗+3.1。66
由此得出两点分析。第一,多数战场州的差距小于3–5个百分点的典型民调误差,因此每场竞选都接近抛硬币,略偏向民主党。第二,这些竞选相互关联。如果全国民调高估民主党3个百分点,几个最胶着的竞选会同向变动,因此在七个Toss Up中恰好赢下四个或更多的概率,低于把它们视为独立事件相乘所得的概率。这些州2024年的总统选举差距为:阿拉斯加和艾奥瓦共和党+13,俄亥俄共和党+11,得克萨斯共和党+14,缅因民主党+7。67
部分参议院竞选还显示候选人层面的韧性。Cook指出,缅因州参议员苏珊·柯林斯(Susan Collins)在唐纳德·特朗普三次落败的州内仍具竞争力,Cook以此说明民主党的党派品牌相对于总统声望较弱。68 这是有益的制衡:全国环境对民主党有利,但该党自身的好感度并不同样强势。
预测市场对民主党控制参院的定价约为62%–64%:据10月13–14日发布的汇总,Polymarket为63.5%,Kalshi约61%。69,70 已发布的模型更低:Silver Bulletin的FLIPR模型在一次市场评论发布时为57.3%,Decision Desk HQ 10月1日的预测为54%。71,72 报告约56%的估计处于模型区间的上沿、低于市场区间。相对市场打折的依据是上述相关性误差论证,以及近几周市场向民主党移动,这既可能反映新信息,也可能反映动量。
竞选资金是相关的结构性变量。埃隆·马斯克在2025–26周期向联邦委员会捐款约3.66亿美元,其中7月以来2.76亿美元;1.58亿美元给了参议院领导基金(Senate Leadership Fund),约7600万美元给了America PAC,后者在七个参议院战场和约三十几个众议院选区开展动员行动。73 他此前曾威胁成立第三党“美国党”(America Party),但并未付诸实施。74 另据报道,亲特朗普的超级政治行动委员会MAGA Inc.在8月持有4.16亿美元。75
这种规模的支出能在边际上影响结果,尤其是在得克萨斯这样成本高昂的州,参议院领导基金在那里已花费远超1亿美元。76 关于广告和动员支出在信息充分的竞选中能在多大程度上改变结果,证据并不一致,其影响可能小于总额所显示的规模。报告把资金优势视为:尽管全国环境如此,仍不把民主党两院全胜的概率定在约54%以上的理由之一。
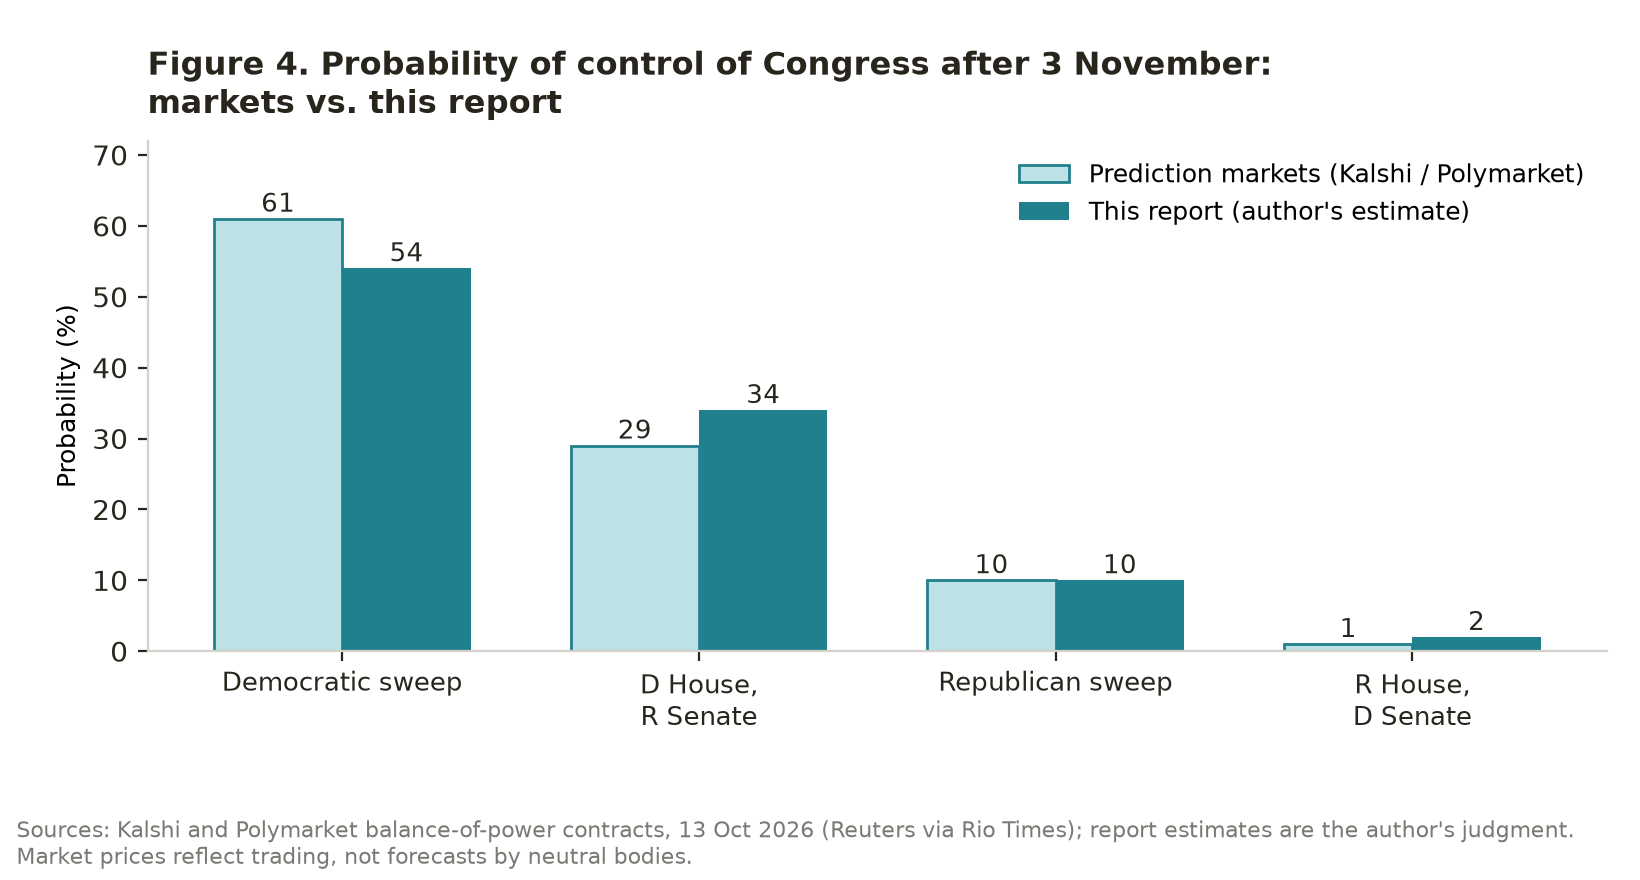
| 情景 | 预测市场 | 本报告 | 主要驱动因素 |
|---|---|---|---|
| A. 民主党两院全胜 | 60%–62% | 约54% | 泛国会投票领先持续在民主党+7以上;民主党在阿拉斯加、艾奥瓦、缅因、俄亥俄、得克萨斯和堪萨斯战场中拿下四个,同时守住密歇根、佐治亚和新罕布什尔 |
| B. 民主党控众院、共和党控参院 | 28%–30% | 约34% | 全国民主党领先约5–8个百分点,而参院地图有利于在特朗普以两位数优势获胜的州中的共和党现任者 |
| C. 共和党两院全胜 | 10%–11% | 约10% | 民调出现4个百分点以上的有利共和党的偏差,或汽油价格在后期下降并通过外交解决伊朗冲突 |
| D. 共和党控众院、民主党控参院 | 约1% | 约2% | 需要不寻常的分裂,例如民主党赢下参院各州,而选区图使共和党守住众院 |
市场数字来自77和78。报告的数字合计100%,属于判断,每项周围的置信区间很宽:情景A的合理区间为42%–64%。
以下为分析性含义,而非对具体政策的预测。
尚无主要候选人正式宣布参选。辩论日程尚未确定:辩论由竞选团队和媒体机构组织,而非由法律规定,预计初选辩论将从2027年开始。80 因此目前的证据仅限于早期提名民调、大选对决测试和少数公开表态。
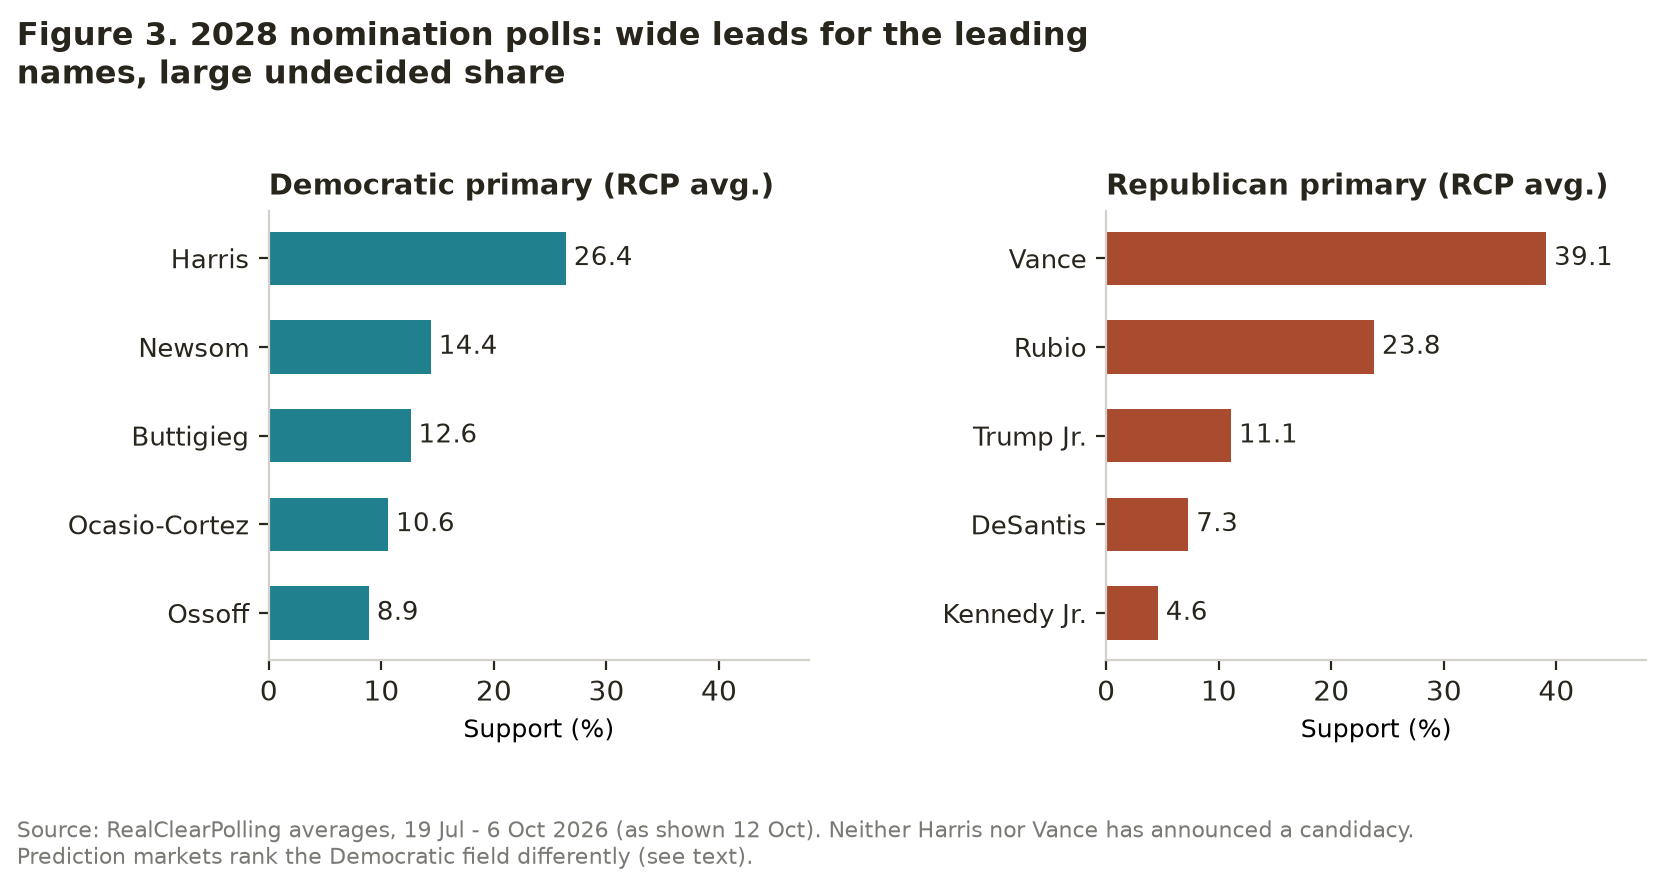
均值显示卡玛拉·哈里斯(Kamala Harris)排名第一,领先约12个百分点。RealClearPolling均值(7月19日–10月6日)为:哈里斯26.4%,加文·纽森(Gavin Newsom)14.4%,皮特·布蒂吉格(Pete Buttigieg)12.6%,亚历山德里亚·奥卡西奥-科尔特斯(Alexandria Ocasio-Cortez)10.6%,乔恩·奥索夫(Jon Ossoff)8.9%。81《金融时报》/Focaldata 10月2–5日的调查为:哈里斯30%,纽森15%,布蒂吉格9%,奥卡西奥-科尔特斯9%,奥索夫8%,14%未决定。82 Harvard CAPS/Harris在9月下旬为哈里斯38%、纽森17%;The Center Square的Noble Predictive民调(10月5–7日)中哈里斯为29%。83,84
纽森在9月14日的CNN采访中说:“如果她参选,我不会参选。”85 他把两人之间的竞争称为“相互确保毁灭”,理由是双方支持者高度重叠。86 分析人士提出两种解读:真诚的礼让,或是促使哈里斯作出决定的策略性举动;二者均未得到证实。87,88 哈里斯尚未宣布是否参选。89
预测市场与民调明显分歧。据9月底的报道,Polymarket赔率中奥卡西奥-科尔特斯以逾19%领先,奥索夫16%,纽森12.7%,哈里斯8%。90 有两种可能的解释:市场可能预期哈里斯决定不参选;或者市场参与者对大选实力和初选动态的权重不同于只说出熟悉名字的调查受访者。知名度是早期初选民调的已知驱动因素,而选举前两年的民调屡次未能识别最终的提名人:希拉里·克林顿在为2008年所做的2006年民调中领先,杰布·布什在为2016年所做的2014–15年的许多民调中居于前列。
RealClearPolling均值为:J.D.万斯(JD Vance)39.1%,马可·卢比奥(Marco Rubio)23.8%,小唐纳德·特朗普11.1%,罗恩·德桑蒂斯(Ron DeSantis)7.3%,小罗伯特·肯尼迪4.6%。91《金融时报》/Focaldata民调为:万斯38%,卢比奥24%,德桑蒂斯9%,小特朗普7%,肯尼迪7%,12%未决定。92 《国会山报》援引消息人士报道,卢比奥告诉捐款人和盟友他不会与万斯竞争,万斯则表示他专注于中期选举。93 这些是报道,而非正式宣布。
Emerson学院民调的早期对决测试显示出狭窄且不均衡的图景:哈里斯49%对万斯45%;卢比奥48%对哈里斯43%;纽森49%对万斯44%;纽森48%对卢比奥46%;布蒂吉格以49比44同时领先万斯和卢比奥。94 奥索夫和纽森领先万斯5个百分点,但分别落后卢比奥3个和2个百分点,奥卡西奥-科尔特斯则落后于两位共和党人。95 Morning Consult在较早的调查中显示哈里斯对万斯领先1个百分点,对卢比奥领先2个百分点。96
由此得出三点结论。第一,没有任何候选人在对决中有持久的领先;多数在5个百分点以内,这处于正常误差范围和两年内正常变化范围之内。第二,跨调查的模式一致:共和党人卢比奥在对阵若干民主党人时表现略好于万斯,这表明在该样本中,候选人个人的好感度比党派标签更重要。第三,知名度和当前对执政党不利的中期选举环境,很可能以逐渐消退的方式影响这些数字。
2024年的结果是2028年建模的必要参照。唐纳德·特朗普获得49.80%的普选票,卡玛拉·哈里斯为48.32%,差距2,284,967票,即1.48个百分点;选举人票312对226。特朗普赢下全部七个摇摆州,差距从威斯康星的0.86个百分点到亚利桑那的5.53个百分点不等。97 结果在选举人团层面是决定性的,在普选票层面则很接近。这对2028年的分析很重要:候选人的全国好感度与选票在七个州的分布是不同的变量,二者都会进入结果。
辩论可能影响大选,但关于影响有多大的证据有限。2024年,乔·拜登与唐纳德·特朗普6月27日的首场大选辩论被普遍认为对总统不利,拜登在党内压力不断增大后于7月21日退出。98,99 随后哈里斯与特朗普于9月10日举行了一场辩论,因此该周期共举行两场大选辩论,而非三场。100 自1960年以来,没有任何一年的总统辩论超过三场。101 总统辩论委员会原计划2024年举行三场辩论,但两个竞选团队对形式和时间提出异议,委员会因此被绕开。102 因此,2028年辩论的数量、时间和主办方尚未确定。
分析上的教训是:辩论是重要的信息事件,尤其是在揭示选民此前未曾观察到的情况时,如2024年的那场辩论。当两位候选人的表现都在正常范围内时,较少证据表明辩论能可靠地改变大量选民的选择。因此,报告把辩论视为结果方差的来源,而非决定性因素。
一种常见的简化把选民分为各约40%的两个党派基本盘和约20%的可争取的中间选民。这一简化有用但有局限。自认独立的选民是异质群体,其中很大一部分稳定地倾向某一政党。关于投票行为的研究总体发现,总统选举中真正可说服的选民占比小于自认独立选民的占比,而边缘选民的投票率与说服同样重要。实际含义是:2028年将由基本盘动员、少数可说服选民的偏好以及约七个州的选举人团地理格局共同决定。
候选人属性,包括沟通能力、好感度、行政经验、联盟的广度以及团结政党的能力,与所有这些渠道相关。属性在两年前很难衡量,且支持者与反对者的评价往往不同。因此,本报告不按个人素质对候选人排名,而是指出分析人士将跟踪的可观察变量:独立选民中的好感度;在西班牙裔、年轻和郊区选民中的表现;筹款;以及初选日程的结果。
美国选举通过四条渠道影响全球经济。以下陈述为带有明确置信度的假设,并与InsightBridge关于“被迫型区域化”的配套论文中的框架相衔接。
| 观察指标 | 提高民主党胜算的情形 | 降低民主党胜算的情形 |
|---|---|---|
| 泛国会投票均值 | 持续在民主党+8以上 | 低于民主党+6 |
| 总统支持率(均值) | 低于38% | 高于42% |
| 汽油(AAA) | 保持在4.30美元以上 | 跌破4.00美元 |
| 参院战场 | 得克萨斯、俄亥俄、阿拉斯加的领先保持 | 缅因或艾奥瓦的领先消失 |
| 提前投票构成 | 年轻和边缘选民投票率高 | 战场州共和党提前投票追赶 |
| 9月和10月CPI | 总体通胀高于3.7% | 总体通胀和汽油价格同时下降 |
| 伊朗会谈 | 破裂或对航运的进一步攻击 | 签署重新开放霍尔木兹的协议 |
| 2028年宣布参选 | 11月3日后的早期宣布 | 重要宣布推迟 |
证据支持对11月3日的清晰中心预期:民主党赢得众议院多数的可能性很高;民主党赢得参议院的可能性略高于一半,但取决于在2024年大比分投给共和党的州中的少数相关竞选;整体上最可能的结果是民主党两院全胜。这一预期建立在泛国会投票约8个百分点的全国差距、总统支持率处于低位和能源驱动的生活成本上升之上。它受到以下因素的限制:得票与席位之间的差距、选区重划、历来常有利于共和党的民调误差,以及民调中好感度低于全国差距所显示水平的民主党品牌。
对于2028年,证据只支持两项明确陈述。两党的人选都是开放的,领跑者的支持率约在26%–39%之间,且未决定比例较大。早期对决测试没有显示任何一党的持久优势。对全球读者而言,中期选举的现实意义,与其说在于眼前的席位数,不如说在于结果对政策连续性、贸易权限、能源价格以及盟友规划期限所发出的信号。
殷彤博士(Dr Tong Yin),美国洞见桥全球公司(InsightBridge Global LLC)及其姊妹研究机构洞见桥全球实验室(InsightBridge Global Lab LLC)创始人兼首席研究官,常驻美国阿拉巴马州奥本市。殷彤博士获奥本大学博士学位,并曾在该校任教;另获美国东伊利诺伊大学工商管理硕士(MBA)学位。创立洞见桥之前,他在美国、中国、澳大利亚和欧洲的国际企业担任高级管理职务长达二十年,行业涵盖酒店、专业服务和全球制造,负责运营、商业战略和跨境扩张。
他的研究领域包括地缘政治风险、宏观经济再平衡、人工智能战略和组织韧性,提出了核心密码理论(Core Code Theory)、家园模型(Home Model)、治理负债(Governance Debt)和动态驱动替代理论(DDRT)等原创分析框架。他主笔双语战略情报周刊《洞见桥全球情报网》(InsightBridge Global Intelligence),读者包括主权财富基金、中央银行、政府部委和机构投资人;同时是 Hospitality Net、Hotel News Resource 和 PhocusWire 的长期撰稿人。他以英语和普通话工作。
联系方式:tongyin@insightbridge.global | https://intelligence.insightbridge.global
本报告是由 InsightBridge Global 及 InsightBridge Global Lab 发布的独立第三方分析。本报告与美国或其他任何国家的任何政党、候选人、竞选团队、政府、政治行动委员会或倡导组织均无隶属、资助或指导关系,不带有任何政治、党派、意识形态或国家倾向。报告中对政党、候选人和官员的提及仅为描述性的,目的仅在于报告公开事实和已发布的数据,不构成支持、反对或批评。
概率和情景是作者基于2026年10月14日可得信息作出的分析判断,不是对确定结果的预测,选举结果仍具不确定性。民调结果、预测市场价格和预测模型输出均按其来源报告引用,可能变动或被修订;本报告未对其进行独立审计。本报告不构成投资、法律、税务或投票建议。文中观点仅代表作者殷彤博士个人,不必然代表 InsightBridge Global 或 InsightBridge Global Lab 的立场。
Independence statement. This report is an independent, third-party analysis. It takes no political, partisan, ideological or national position. It describes evidence and assigns probabilities; it does not recommend how anyone should vote. The full disclaimer appears at the end of the report and is also published as a standalone document.
The United States will hold midterm elections on 3 November 2026, with all 435 House seats and 35 Senate seats on the ballot.1 Three weeks before the vote, the available evidence points to a clear but not uniform national environment. The presidential approval rating is at or near the lowest level of the second term, the generic congressional ballot favours the Democratic Party by roughly 8 points across the main averages, and consumer prices have been pushed up by an energy shock linked to the Iran conflict. At the same time, translating a national vote margin into seats depends on district maps, candidate quality and turnout, and the Senate map requires Democrats to win several states that President Trump carried by double digits in 2024.
The report reaches five key judgments. Probabilities are the author’s analytical estimates, built from polling averages, prediction-market prices, published forecast models and historical error patterns. They are not forecasts by any official body.
| # | Key judgment | Estimate | Confidence |
|---|---|---|---|
| 1 | Democrats win a House majority (218 seats) | About 88% (market range 85–91%) | High |
| 2 | Democrats win Senate control (net gain of four seats) | About 56% (market range 61–64%; model range 54–57%) | Low to moderate |
| 3 | Most likely outcome is a Democratic sweep (about 54%); the second most likely is a Democratic House with a Republican Senate (about 34%) | See Section 7 | Moderate |
| 4 | Energy-driven inflation and the cost of living are the main economic channel behind the current environment; a late fall in gasoline prices would narrow, but probably not close, the gap before 3 November | Qualitative | Moderate |
| 5 | The 2028 contest is wide open: leading names in both nomination polls hold large but soft leads, and early general-election polls are weak predictors | Qualitative | High |
Three further points frame the analysis. First, poll-based leads and market prices are not independent evidence; many market traders read the same polls. Second, the 2024 election showed that national polls can understate the Republican share by about 3 points in swing states, so a Republican over-performance of that size remains plausible and would matter most in the Senate.2 Third, the midterm result and the 2028 result are only loosely linked: the 2010 Republican wave was followed by the 2012 re-election of the Democratic president, and the 2018 Democratic wave was followed by the 2020 defeat of the Republican incumbent, which shows that midterm outcomes shape the political agenda more than they determine the next presidential result.
The generic congressional ballot asks respondents which party they would support for Congress without naming candidates.3 It is the standard summary of the national environment, but it has four limits that matter for interpretation.
The report uses a triangulation approach rather than a single model. It compares (a) three or more polling aggregators with different methods, (b) two prediction markets, (c) published forecast models, and (d) historical benchmarks for the relationship between national margin and seat change. Where sources disagree, the disagreement is stated and the report adopts a value inside the range, with a discount for known sources of error. The same principle of cross-checking opposing or independent sources applies to the 2028 sections.
Presidential approval is the most consistent predictor of the president’s party’s midterm performance. Current readings are low across pollsters, though levels differ by method.
| Measure | Reading | Source |
|---|---|---|
| Pew Research Center (28 Sep–4 Oct) | 30% approve, 68% disapprove | 8 |
| Reuters/Ipsos (30 Sep–5 Oct) | 32% approve, 65% disapprove | 9 |
| AP-NORC (24–28 Sep) | 31% approve, 69% disapprove | 10 |
| Morning Consult (9–11 Oct) | 42% approve, 56% disapprove | 11 |
| Rasmussen (likely voters, 12 Oct) | 41% approve, 58% disapprove | 12 |
| Aggregators (8 Oct) | RealClearPolitics 38.3%; New York Times 37%; Silver Bulletin 37.1% | 13 |
The spread between pollsters (30% to 42%) shows that house effects and population definitions matter, but no major series places approval above the mid-40s. The Wall Street Journal’s 37% reading is the lowest for a president heading into a midterm in that poll’s series since 1990.14 For context, Gallup measured 43% for President Trump at the same point of his first term, which preceded a 2018 midterm in which his party lost 41 House seats.15,16
Approval of economic management is lower still: 28% in a Financial Times/Focaldata poll.17 Approval among Trump’s own 2024 voters has fallen from 95% early in the term to 67% in the Pew survey.18
There is also evidence moving in the other direction. The Economist/YouGov series shows net approval among Black and Hispanic respondents improving by about 19–20 points across three consecutive polls from 18 September to 5 October, albeit from very low levels.19 Aggregates also move day to day; Silver Bulletin’s net figure was −22.4 on 14 October after touching −23.9 at the weekend.20
Democratic leads are consistent across the main averages.
| Aggregator | Democrats | Republicans | Margin | Date |
|---|---|---|---|---|
| RealClearPolling | 50.2 | 41.9 | D+8.3 | 21 Sep–11 Oct 21 |
| Silver Bulletin (default) | n.a. | n.a. | D+8.8 | 13 Oct 22 |
| Silver Bulletin (likely voters) | n.a. | n.a. | D+9.5 | 12–13 Oct 23 |
| Decision Desk HQ | 49.0 | 41.3 | D+7.7 | 13 Oct 24 |
The median of the three default aggregator readings is about D+8. Over the last month the margin moved from roughly D+6.5 to D+8.9 (Silver Bulletin), from D+5.7 to D+8.5 (RealClearPolitics) and from D+6.7 to D+7.7 (DDHQ).25 The movement is therefore recent, and recent movement can partly reverse.
Historical comparison shows why the margin matters but does not determine the seat count. In 2018 Democrats won the national House vote 53.4% to 44.8% (D+8.6) and gained 41 seats.26 In 2010 Republicans won 51.7% to 44.9% (R+6.7) and gained about 63 seats.27 In 2022 Republicans won 50.0% to 47.3% and gained 9 seats.28 The conversion of votes to seats therefore varied from roughly 3 to 9 seats per point of margin across these three cycles. Applying even the lower end of that range to a D+8 environment would imply a Democratic gain well above the three seats needed, but the 2026 maps are different, and the report therefore treats seat conversion separately in Section 4.
More than 3.7 million mail-in and early in-person ballots had been cast nationally as of 14 October, and about 51.7 million mail ballots had been requested or sent.29 In Georgia, 188,667 ballots were accepted on the first day of early voting, above the first-day total in 2022.30 Ohio reported 194,481 early in-person votes with 21 days left, against 50,368 at the same point in 2022.31 CNN’s early analysis, as summarised by Ground News, shows an early Democratic turnout advantage, but early-vote composition is a weak predictor because the two parties’ voters now differ in their preferred voting method.32 The early-vote evidence indicates high engagement; it does not by itself indicate which party will benefit.
The economic picture is mixed rather than uniformly negative, which is typical of an energy supply shock.
| Indicator | Latest reading | Source |
|---|---|---|
| CPI inflation, September (year on year) | 3.7% (August: 3.4%) | 33 |
| Core CPI (excluding food and energy) | 2.6% (August: 2.4%) | 34 |
| Gasoline CPI, monthly change in September | +9.1%, over half the monthly increase | 35 |
| Energy CPI, 12 months | +20.4%; gasoline +34.2% | 36 |
| AAA national average gasoline price | $4.33 (14 Oct), versus $3.07 a year ago; above $4 on a record 158 days this year | 37 |
| Real GDP growth, Q2 2026 (third estimate) | 2.2% annualised; Q1 revised to 2.5% | 38,39 |
| Payrolls and unemployment, September | +29,000 jobs; unemployment 4.2% | 40 |
| Federal funds rate target | 3.75%–4.00% after a 25 basis point rise on 16 September, the first hike since 2023 | 41 |
| Brent crude, early–mid October | Roughly $98–106 per barrel, against about $72 before the conflict | 42,43 |
The combination of positive growth, a low but softening labour market, rising headline inflation and a central bank that is tightening is the main economic context for the vote. Gasoline is the most visible price. The AAA reading of $4.33 compares with $4.36 a week earlier, so there is a mild easing at the pump, but prices remain at record levels for autumn.44
Three channels link the energy shock to the electoral environment.
Economic conditions explain part of the environment but not all of it. Real consumer spending and investment were strong in Q2 (real final sales to private domestic purchasers rose 4.6%), and initial jobless claims have been at historically low levels.46,47 The September payroll figure of 29,000 jobs, with revisions that removed 60,000 jobs from July and August, suggests a cooling.48 Voters’ ratings are also influenced by other factors, including views on the Iran conflict, immigration and trade policy. The report therefore treats the cost of living as the largest identifiable factor, not the only one.
The conflict that began on 28 February 2026 remains unresolved. Reuters reports that the U.S. Energy Information Administration now forecasts Brent at about $105 per barrel in the fourth quarter and about $98 for 2026.49 Kpler ship-tracking data show Hormuz crude exports averaging about 8.5 million barrels per day in the week to 7 October, about 40% below pre-war levels, and the International Energy Agency has described the disruption as the largest supply disruption in the history of the oil market.50 These conditions imply that the energy-price risk to the election is two-sided: a diplomatic opening would lower prices quickly, whereas further attacks on shipping would raise them. Announcements of talks have already moved Brent by several dollars in a single session.51
Democrats hold 214 seats and need 218, a net gain of about three to four.52 Cook Political Report’s ratings of 9 October place 185 seats in Solid Democratic, 16 in Likely Democratic and 12 in Lean Democratic, against 174 Solid Republican, 18 Likely Republican and 9 Lean Republican, with 21 Toss Ups.53 Counting the 213 seats at least leaning Democratic, Democrats are within five seats of a majority before any Toss Up is decided. Cook shifted a large block of seats toward Democrats on 9 October, including five Toss Ups moved to Lean Democratic in Iowa, Pennsylvania and Washington.54
A comparison of seats rated Toss Up or worse by party shows the structure: 23 Republican-held and 11 Democratic-held seats in October 2026, against 45 and 3 in October 2018, and 12 and 30 in October 2022.55 The 2026 imbalance is smaller than the 2018 one. That is consistent with the effect of redistricting and with fewer Republican seats in highly competitive territory than in 2018.
The 2025–26 mid-decade redistricting round is the main structural difference from 2018. Republicans had hoped to gain 13 seats from new maps, but House Majority Whip Tom Emmer said they would not win all 13, and Cook now projects a net gain of about 4 seats from redistricting alone.56 Emmer also said Republicans could lose five seats combined because of redistricting in California and Utah.57 The practical implication is that maps reduce the Democratic seat gain by roughly four seats relative to a no-redistricting baseline, but do not remove a D+8 advantage.
Cook’s most likely outcome, as cited by one tracker, is a Democratic gain of 9 to 19 seats, for 224 to 234 in total.58 Polymarket’s projected seat count is 234–201.59 Taking those ranges and a symmetric uncertainty of several points of national margin, the report’s central range is 222–238 Democratic seats. That implies a probability of a Democratic majority of about 88%. Three reasons argue against going much higher: the average could partly reverse, a 3-point Republican polling miss would still leave Democrats as favourites but narrow the margin, and about 21 Toss Ups remain. Three reasons argue against going lower: the lead has been stable above D+6 since August, early Democratic engagement indicators are positive, and the seat gap to a majority is small.
Republicans hold 53 of the 100 Senate seats. Thirty-five seats are up for election, including special elections in Florida and Ohio; 23 of the 35 are Republican-held.60 Democrats need a net gain of four seats for 51, because Vice President JD Vance breaks 50–50 ties.61 The NBC News analysis notes that Democrats must hold Michigan, Georgia and New Hampshire, and win in several states Trump carried by double digits in 2024.62
Cook’s current ratings place Alaska, Iowa, Maine, Ohio and Texas as Toss Ups, with North Carolina at Lean Democratic, and Cook describes control of the chamber as a true toss-up.63 Cook now also describes Kansas as a toss-up after a New York Times/Siena poll showing a 45–45 tie between Republican Senator Roger Marshall and Democrat Adam Hamilton.64
New York Times/Siena polls of likely voters show Mary Peltola ahead of Dan Sullivan 50–43 in Alaska, James Talarico ahead of Ken Paxton 51–45 in Texas, Sherrod Brown ahead of Jon Husted 49–46 in Ohio, a 45–45 tie in Kansas, and Ashley Hinson ahead of Josh Turek 48–47 in Iowa.65 In the RealClearPolitics averages compiled by Election Central, Democratic candidates lead in 10 of 12 tracked races, but the margins in the decisive states are small: Turek +0.6 in Iowa, Jackson +1.2 in Maine, Peltola +1.4 in Alaska, Talarico +2.6 in Texas and Brown +3.1 in Ohio.66
Two analytical points follow. First, the margins in most battleground states are smaller than the typical polling error of 3–5 points, so each race is close to a coin flip with a Democratic tilt. Second, the races are correlated. If polls overstate Democrats by 3 points nationally, several of the closest races would move together, so the chance of winning exactly four or more of seven toss-ups is lower than a product of independent probabilities suggests. The 2024 presidential margins in these states were R+13 in Alaska and Iowa, R+11 in Ohio, R+14 in Texas and D+7 in Maine.67
Some Senate races also show candidate-level resilience. Cook notes that Senator Susan Collins of Maine remains competitive in a state Donald Trump lost three times, which Cook cites as an illustration of a weaker Democratic party brand relative to the president’s standing.68 This is a useful counterweight: the national environment is favourable to Democrats, but the party’s own favourability is not equally strong.
Prediction markets price a Democratic Senate at about 62–64%: Polymarket 63.5% and Kalshi about 61%, according to compilations published on 13–14 October.69,70 Published models are lower: Silver Bulletin’s FLIPR model gave 57.3% at the time of one market commentary, and Decision Desk HQ’s forecast gave 54% on 1 October.71,72 The report’s estimate of about 56% sits at the upper end of the model range and below the market range. The basis for the discount to markets is the correlated-error argument above and the fact that markets have been trending toward Democrats in recent weeks, which can reflect momentum as much as new information.
Campaign finance is a relevant structural variable. Elon Musk has given about $366 million to federal committees in the 2025–26 cycle, including $276 million since July, of which $158 million went to the Senate Leadership Fund and about $76 million to America PAC, which runs a turnout operation in seven Senate battlegrounds and nearly three dozen House races.73 He had earlier threatened to form a third party, the America Party, but has not done so.74 Separately, MAGA Inc., the pro-Trump super PAC, was reported to hold $416 million in August.75
Spending of this scale can affect outcomes at the margin, particularly in expensive states such as Texas, where the Senate Leadership Fund has spent well over $100 million.76 The evidence on how much advertising and turnout spending moves outcomes in high-information races is mixed, and it is likely to be smaller than the headline totals suggest. The report treats the funding advantage as one reason for not assigning more than about 54% to the Democratic sweep despite the national environment.
| Scenario | Prediction markets | This report | Main drivers |
|---|---|---|---|
| A. Democratic sweep (House and Senate) | 60–62% | About 54% | Generic ballot above D+7 persists; Democrats win four of the Alaska, Iowa, Maine, Ohio, Texas and Kansas battlegrounds while holding Michigan, Georgia and New Hampshire |
| B. Democratic House, Republican Senate | 28–30% | About 34% | A national Democratic margin of about 5–8 points with a Senate map that favours Republican incumbents in states carried by Trump by double digits |
| C. Republican sweep | 10–11% | About 10% | A polling miss of 4 or more points in Republican favour, or a late fall in gasoline prices and a diplomatic resolution of the Iran conflict |
| D. Republican House, Democratic Senate | About 1% | About 2% | Requires an unusual split, for example Democratic wins in Senate states with a map-driven Republican House hold |
Market figures are from 77 and 78. The report’s figures sum to 100%. They are judgments, and the confidence interval around each is wide: a reasonable range for scenario A is 42–64%.
The following are analytical implications, not predictions of specific policies.
No major candidate has formally announced. Debate schedules have not been set: debates are organised by campaigns and media organisations, not set by law, and primary debates are expected from 2027.80 The current evidence is therefore limited to early nomination polls, general-election trial heats and a small number of public statements.
Averages put Kamala Harris first with a lead of about 12 points. The RealClearPolling average (19 July–6 October) shows Harris 26.4%, Gavin Newsom 14.4%, Pete Buttigieg 12.6%, Alexandria Ocasio-Cortez 10.6% and Jon Ossoff 8.9%.81 The Financial Times/Focaldata survey of 2–5 October found Harris 30%, Newsom 15%, Buttigieg 9%, Ocasio-Cortez 9% and Ossoff 8%, with 14% unsure.82 Harvard CAPS/Harris in late September had Harris at 38% and Newsom 17%, and The Center Square’s Noble Predictive poll (5–7 October) had Harris at 29%.83,84
Newsom said in a CNN interview on 14 September, “I wouldn’t run if she ran.”85 He described a contest between them as “mutual assured destruction,” citing overlapping supporters.86 Analysts have offered two readings, genuine deference or a strategic move that presses Harris to decide, and neither is confirmed.87,88 Harris has not announced whether she will run.89
Prediction markets and polls diverge markedly. According to a report at the end of September, Ocasio-Cortez led the Polymarket odds at over 19%, Ossoff at 16%, Newsom at 12.7% and Harris at 8%.90 Two explanations are possible: markets may anticipate a decision by Harris not to run, or market participants may weigh general-election strength and primary dynamics differently from survey respondents who name a familiar figure. Name recognition is a known driver of early primary polling, and polls two years before an election have repeatedly failed to identify the eventual nominee; Hillary Clinton led the 2006 polls for 2008 and Jeb Bush was among the leaders in many 2014–15 polls for 2016.
The RealClearPolling average shows JD Vance 39.1%, Marco Rubio 23.8%, Donald Trump Jr. 11.1%, Ron DeSantis 7.3% and Robert F. Kennedy Jr. 4.6%.91 The Financial Times/Focaldata poll had Vance 38%, Rubio 24%, DeSantis 9%, Trump Jr. 7% and Kennedy 7%, with 12% unsure.92 The Hill reported, citing sources, that Rubio told donors and allies he will not run against Vance, and Vance has said he is focused on the midterms.93 These are reports, not announcements.
Early trial heats from Emerson College Polling show a narrow and uneven picture: Harris 49%, Vance 45%; Rubio 48%, Harris 43%; Newsom 49%, Vance 44%; Newsom 48%, Rubio 46%; Buttigieg leading both Vance and Rubio 49–44.94 Ossoff and Newsom lead Vance by 5 points but trail Rubio by 3 and 2 points respectively, and Ocasio-Cortez trails both Republicans.95 Morning Consult, in an earlier survey, showed Harris +1 against Vance and Harris +2 against Rubio.96
Three conclusions follow. First, no candidate has a durable lead in matchups; most are within 5 points, which is inside the range of normal error and of normal change over two years. Second, the pattern is consistent across surveys that Republican Rubio performs somewhat better than Vance against several Democrats, which suggests that candidate-specific favourability matters more than party label in this sample. Third, name recognition and the current midterm environment, which is unfavourable to the party in power, are likely to influence these numbers in ways that will fade.
The 2024 result is a necessary reference for 2028 modelling. Donald Trump won 49.80% of the popular vote to Kamala Harris’s 48.32%, a margin of 2,284,967 votes or 1.48 points, and 312 electoral votes to 226. Trump won all seven swing states, with margins ranging from 0.86 points in Wisconsin to 5.53 points in Arizona.97 The result was decisive in the Electoral College and close in the popular vote. This matters for the analysis of 2028: a candidate’s national favourability and the distribution of votes across seven states are separate variables, and both enter the outcome.
Debates are likely to influence the general election, but the evidence on how much is limited. In 2024, the first general-election debate on 27 June between Joe Biden and Donald Trump was widely judged to have gone poorly for the president, and Biden withdrew on 21 July after growing pressure from within his party.98,99 Harris and Trump then held one debate on 10 September, so the cycle included two general-election debates in total, not three.100 Since 1960, no year has had more than three presidential debates.101 The Commission on Presidential Debates, which had planned three debates for 2024, was bypassed after both campaigns objected to format and timing.102 The number, timing and host of 2028 debates are therefore open.
The analytical lesson is that debates are an important information event, particularly when they reveal something voters had not previously observed, as with the 2024 debate. There is less evidence that debates reliably shift large numbers of voters when both candidates perform within the normal range. The report therefore treats debates as a source of variance in the outcome rather than as a deterministic determinant.
A common simplification divides the electorate into two partisan bases of about 40% each and a persuadable middle of about 20%. This simplification is useful but has limits. Self-identified independents are a heterogeneous group, and a large share lean consistently toward one party. Studies of voting behaviour generally find that the share of truly persuadable voters in presidential elections is smaller than the share of self-identified independents, and that turnout among marginal voters is as important as persuasion. The practical implication is that 2028 will be decided by a combination of base mobilisation, the preferences of a small group of persuadable voters, and the Electoral College geography of seven or so states.
Candidate attributes, including communication skill, favourability, executive experience, coalition breadth and the ability to hold a party together, are relevant to all of these channels. Attributes are hard to measure two years ahead and tend to be assessed differently by supporters and opponents. For that reason this report does not rank candidates by personal qualities; it identifies the observable variables that analysts will track: favourability among independents, performance among Hispanic, young and suburban voters, fundraising, and the outcome of the primary calendar.
The U.S. election matters for the global economy through four channels. The statements below are hypotheses with explicit confidence levels, and they connect to the framework in the companion InsightBridge paper on forced regionalization.
| Signpost | What would increase Democratic odds | What would decrease them |
|---|---|---|
| Generic ballot averages | Sustained above D+8 | Below D+6 |
| Presidential approval (averages) | Below 38% | Above 42% |
| Gasoline (AAA) | Stays above $4.30 | Falls below $4.00 |
| Senate battlegrounds | Leads in Texas, Ohio, Alaska hold | Leads in Maine or Iowa disappear |
| Early-vote composition | High turnout among younger and marginal voters | Republican early-vote catch-up in battlegrounds |
| September and October CPI | Headline above 3.7% | Falling headline and falling gasoline |
| Iran talks | Collapse or further shipping attacks | A signed reopening of Hormuz |
| 2028 announcements | Early declarations after 3 November | Delay in major announcements |
The evidence supports a clear central expectation for 3 November: a Democratic House majority is highly likely, a Democratic Senate is slightly more likely than not but depends on a small number of correlated races in states that voted Republican by large margins in 2024, and the likeliest overall result is a Democratic sweep. The expectation rests on a national margin of about 8 points in the generic ballot, low approval ratings for the president, and an energy-driven rise in the cost of living. It is limited by the gap between votes and seats, redistricting, polling error that has often favoured Republicans, and a Democratic brand that polls less favourably than the national margin suggests.
For 2028, the evidence supports only two firm statements. The fields in both parties are open, with leaders at about 26–39% and large undecided shares. Early trial heats show no durable advantage for either party. For global audiences, the practical significance of the midterms lies less in the immediate seat count than in what the result signals about policy continuity, trade authority, energy prices and the horizon over which allies must plan.
Dr Tong Yin is Founder and Chief Research Officer of InsightBridge Global LLC and its sister research entity, InsightBridge Global Lab LLC, based in Auburn, Alabama. He holds a Ph.D. in Hospitality Management from Auburn University, where he also taught, and an M.B.A. from Eastern Illinois University. Before founding InsightBridge, he spent two decades in senior executive roles with international firms in hospitality, professional services and global manufacturing in the United States, China, Australia and Europe, leading operations, commercial strategy and cross-border expansion.
His research covers geopolitical risk, macroeconomic realignment, AI strategy and organizational resilience. He developed the Core Code Theory, the Home Model, Governance Debt and Dynamic Driver Replacement Theory (DDRT) frameworks. He writes InsightBridge Global Intelligence, a weekly bilingual strategic briefing for sovereign wealth funds, central banks, ministries and institutional investors, and contributes regularly to Hospitality Net, Hotel News Resource and PhocusWire. He works in English and Mandarin Chinese.
Contact: tongyin@insightbridge.global | https://intelligence.insightbridge.global
This report is an independent, third-party analysis published by InsightBridge Global and InsightBridge Global Lab. It is not affiliated with, funded by or directed by any political party, candidate, campaign, government, political action committee or advocacy organisation, in the United States or elsewhere. It carries no political, partisan, ideological or national leaning. References to parties, candidates and officials are descriptive and are made solely to report public facts and published data; they do not constitute endorsement, opposition or criticism.
Probabilities and scenarios are the author’s analytical judgments based on information available on 14 October 2026. They are not predictions of certain outcomes, and electoral outcomes remain uncertain. Poll results, prediction-market prices and forecast-model outputs are quoted as reported by their sources and may change or be revised; the report has not independently audited them. This report does not constitute investment, legal, tax or voting advice. The views expressed are those of the author, Dr Tong Yin, and do not necessarily reflect the positions of InsightBridge Global or InsightBridge Global Lab.